12. A modern authoring workflow
Lesson Details
- Lesson: 12
- Description: Authoring front-end projects with integrated DevTools features
The goal of this lesson
To make changes to front-end code using new DevTools features.
What we’ll cover
- Introduction
- DevTools Terminal
- Workspaces
- Sources Diff
- Changes Panel
- Conclusion
Introduction
Changes you make via DevTools are often lost with no way to recover such changes after a page reload. It is usual to copy your changes from DevTools and paste them into your codebase through a code editor. This workflow can be improved.
If you are following along, here are the experiments you need to enable in Chrome Canary.
Don’t forget to:
- View ‘hidden’ experiments by hitting shift 6 times on the experiments panel.
- Restart DevTools (Alt + r) after you enable or disable an experiment.

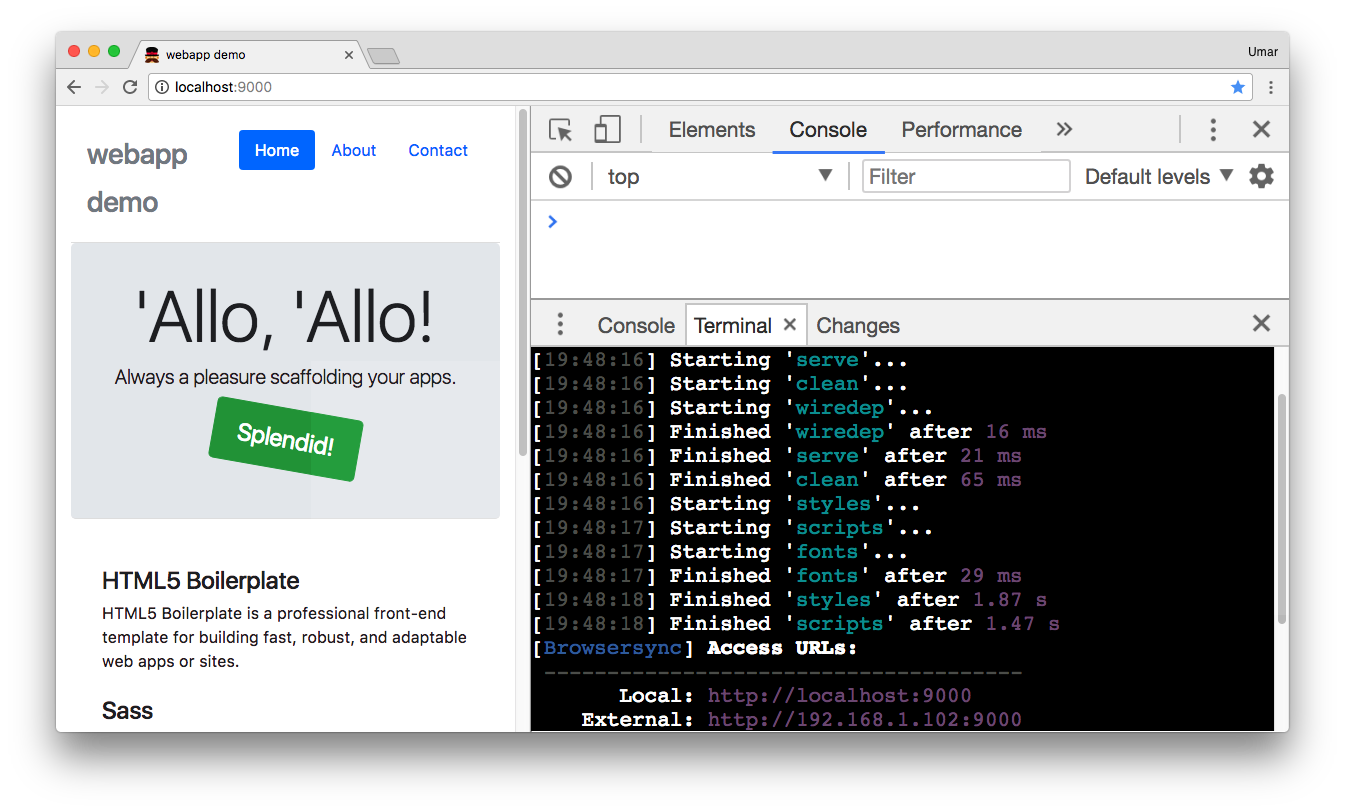
DevTools Terminal
To follow along, run generator-webapp with Yeoman.
You can use the built-in (and experimental) DevTools terminal to run the gulp serve command. Full instructions to running the terminal are here: umaar.com/dev-tips/139-devtools-terminal-linting/.
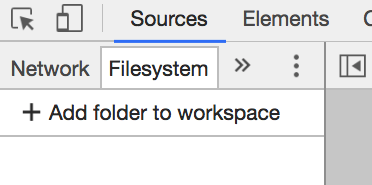
Workspaces
Navigate to the Filesystem pane in the Sources panel.
When you add the webapp you created with generator-webapp, find main.scss .
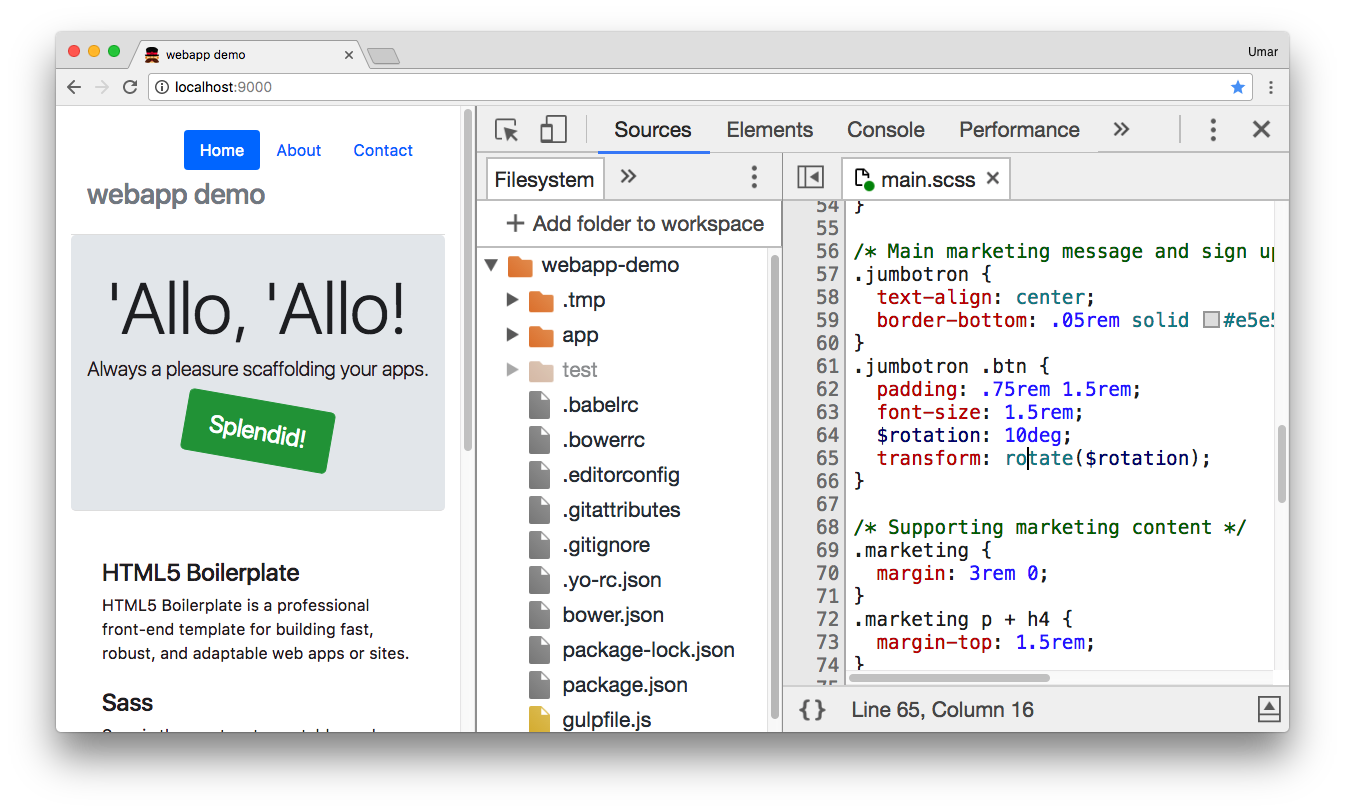
The green icon indicates a mapping has been made with source maps. Try to make a change in the main.scss file and hit Cmd + S / Ctrl + S, notice changes are reflected instantly thanks to browsersync.
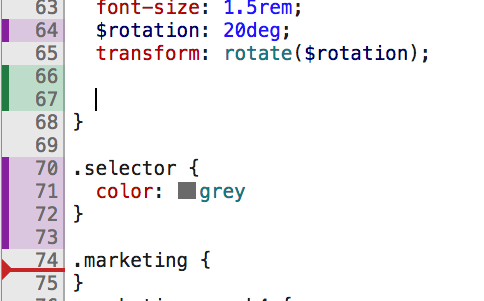
Sources Diff
As you make changes in the Sources panel, the line gutter highlights to indicate a change has been made. The colour also hints at whether the change was a deletion, modification or addition.
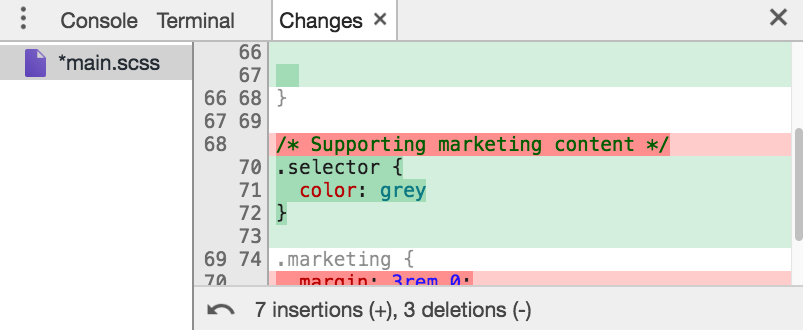
Changes Panel
You can open up the Changes panel from the drawer. Notice it displays all your changes in a git-style diff.
Conclusion
Alt tabbing between various windows to make minor changes to your CSS (and even JavaScript) can sometimes be overkill. Incorporating the features covered in this lesson into your authoring workflow can help make this process smoother.
13. local overrides on Soylent.com
Lesson Details
- Lesson: 13
- Description: Using local overrides with CSS font-display to improve the performance of soylent.com
The goal of this lesson
To improve the page load performance on Soylent.com using the local override feature of DevTools.
What we’ll cover
- Introduction
- Network
- Font display
- Local overrides
- Conclusion
Introduction
Soylent.com loads a custom webfont for some of their text. Before the webfont is ready, the browser hides the text to avoid the potentially jarring UX when switching from a fallback font -> to the webfont. Let’s explore an approach of improving this experience.
Network
Use the screenshots feature within the Network panel to observe the problem.
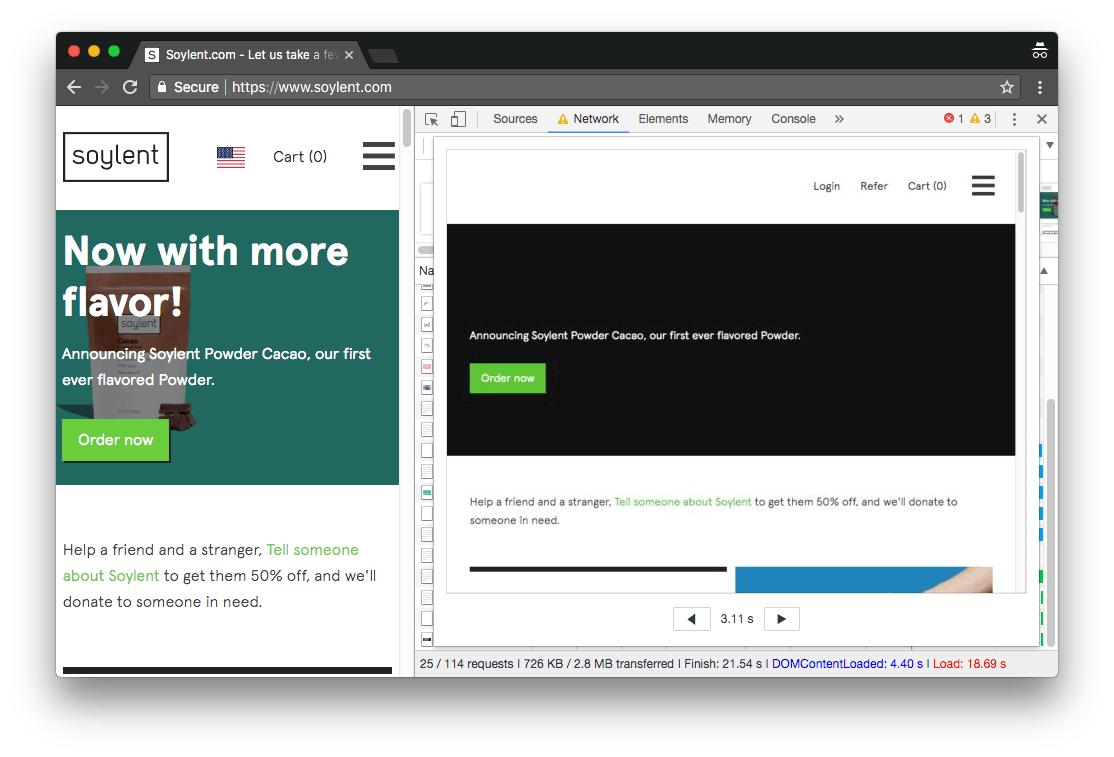
Notice some text has loaded, but the main headline has not.
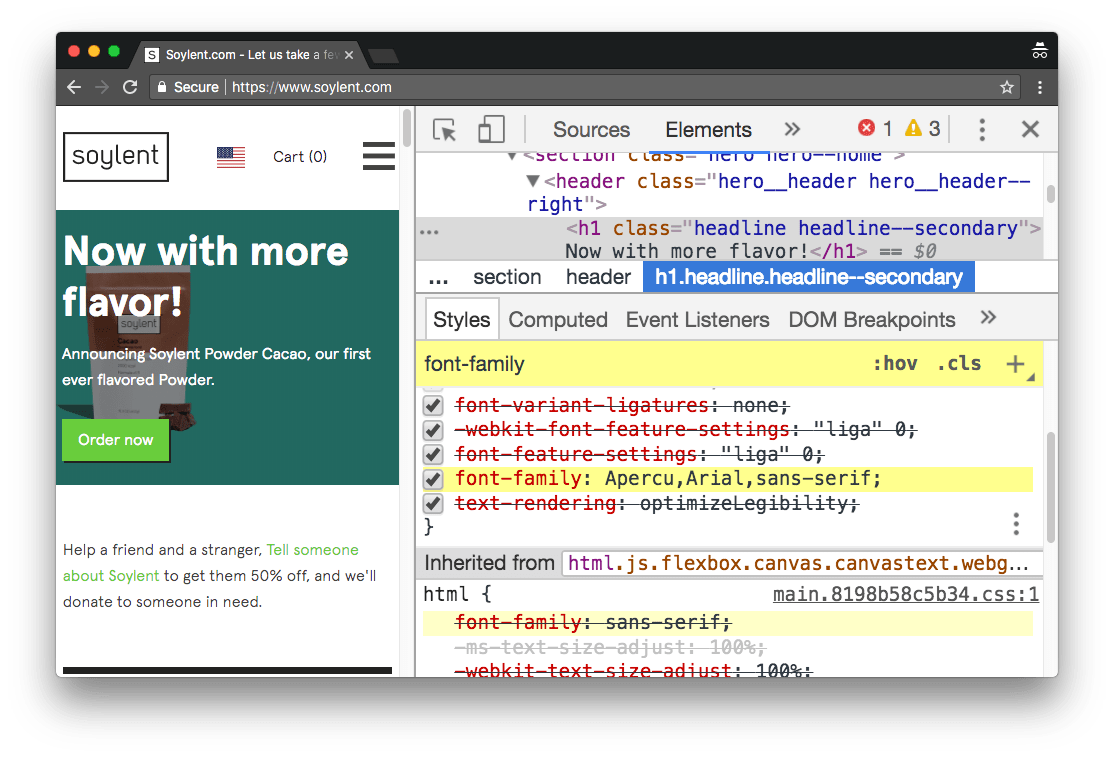
Verify a webfont is being used in the styles pane by inspecting the headline text (once it has visually displayed).
Font Display
One potential improvement is to use the font-display property, specifically: font-display: swap;
Font swap period : If the font face is not loaded, any element attempting to use it must render a fallback font face. If the font face successfully loads during this period, it is used normally.
font-display: swap gives the font face no block period and an infinite swap period.
To use font-display: swap , we must add it into the CSS file which Soylent uses. However the effect of this CSS property manifests itself during page load. If we make changes to the CSS file and reload the page, our changes made via DevTools are lost. Local overrides can fix this.
Local overrides
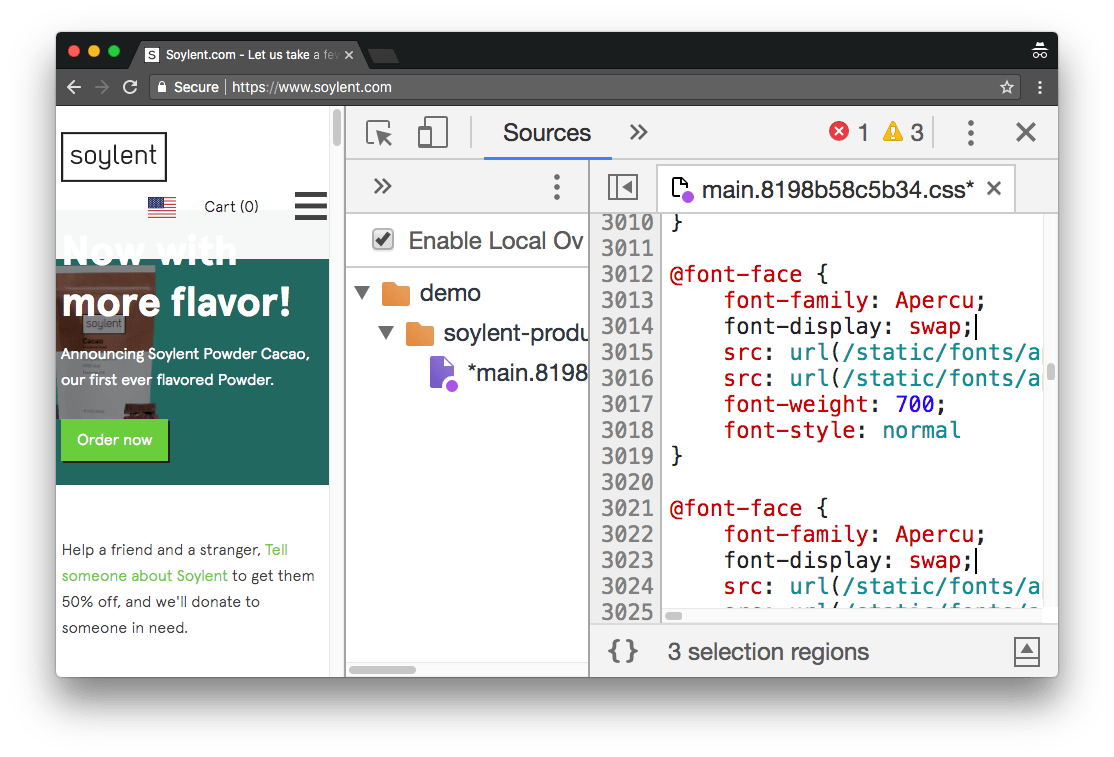
Cmd or Ctrl click onto the font-family CSS property within the styles pane. That takes you to the Sources Panel. From here, pretty print the CSS file. Open the overrides pane in the sidebar of the Sources Panel and enable local overrides. From here, you can right click on the CSS file and select ‘Save for Overrides’.
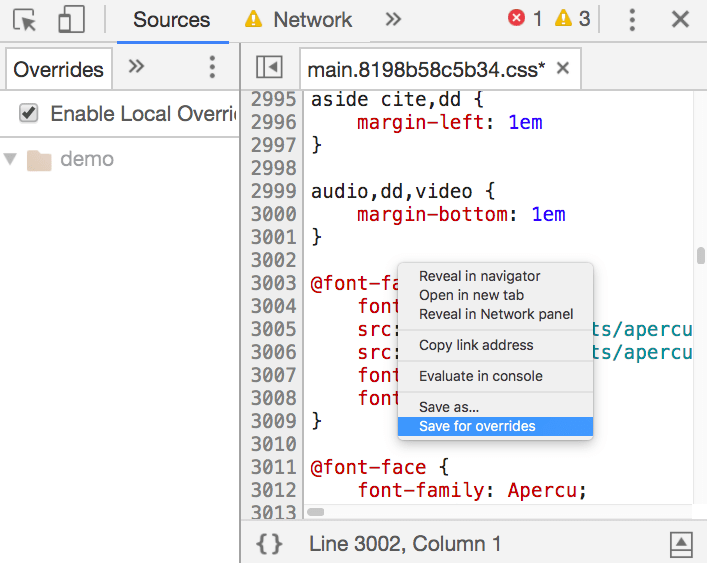
Add font-display: swap; to all the font-face blocks which define the Apercu font.
Save your changes with Cmd / Ctrl + S and reload the page capturing screenshots.
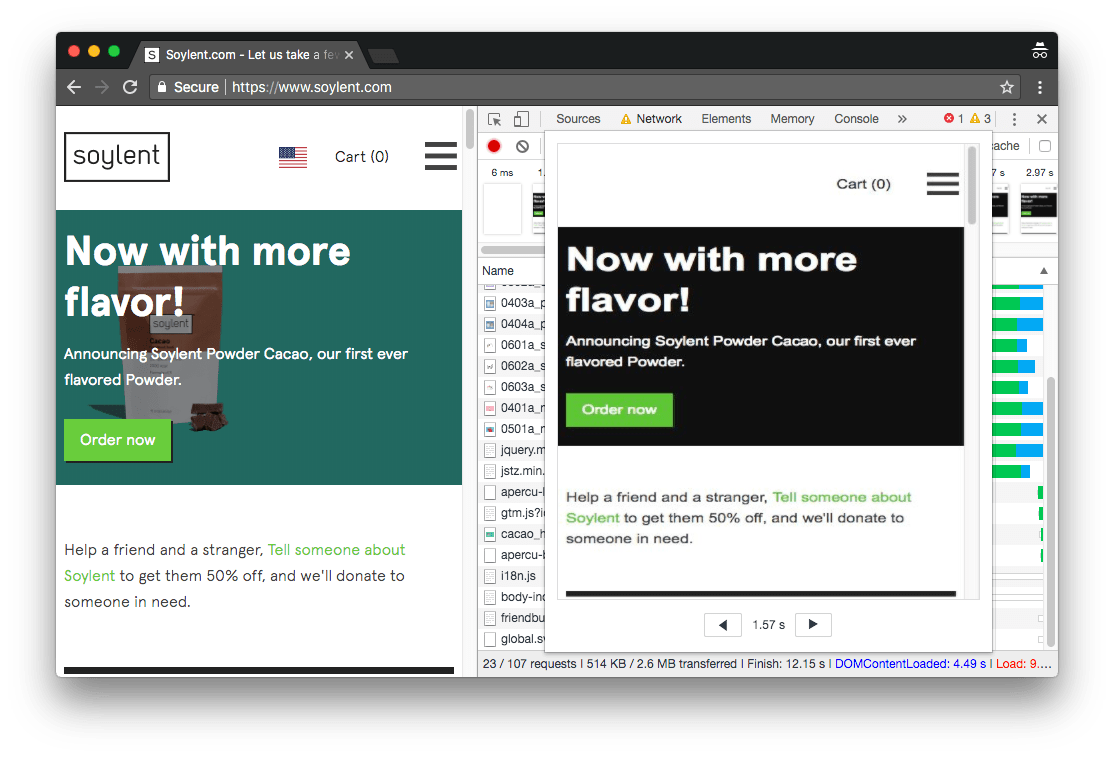
Observe the first paint now includes the text.
Conclusion
In this lesson we used the Network Panel screenshot feature to observe webfont text which has a delay in displaying. We then used the Sources Panel local overrides feature to map a remote resource to our local filesystem resource. We then added the CSS font-display property to the CSS file font-face definitions which persisted after a page reload.
14. Accessibility debugging
Lesson Details
- Lesson: 14
- Description: Debugging webpage accessibility with audits, the a11y pane and colour contrast
The goal of this lesson
To explore three a11y debugging features part of DevTools on real world websites.
What we’ll cover
- Introduction
- Colour contrast
- Accessibility pane
- Accessibility audits
- Conclusion
Introduction
DevTools has a number of useful accessibility related debugging tools built into it. This lesson explores 3 of those.
Colour contrast
On the colour spectrum, the contrast line shows regions where color does and does not meet a minimum contrast ratio. The line is drawn on the threshold between low contrast and an acceptable contrast.
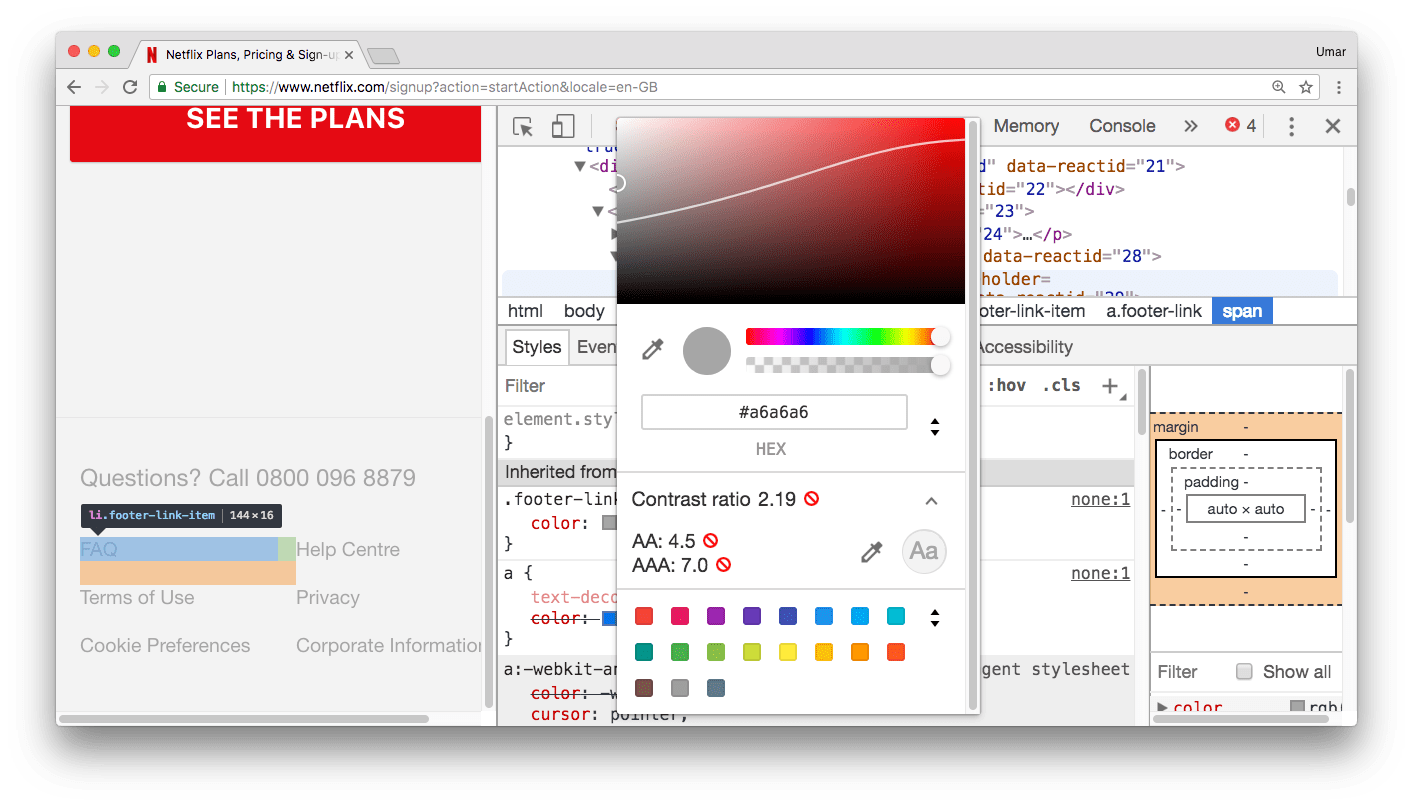
The contrast line takes in account the foreground text colour, and the background colour. It can also take into account background images if you use the colour picker tool to pick a colour from the image.
Accessibility pane
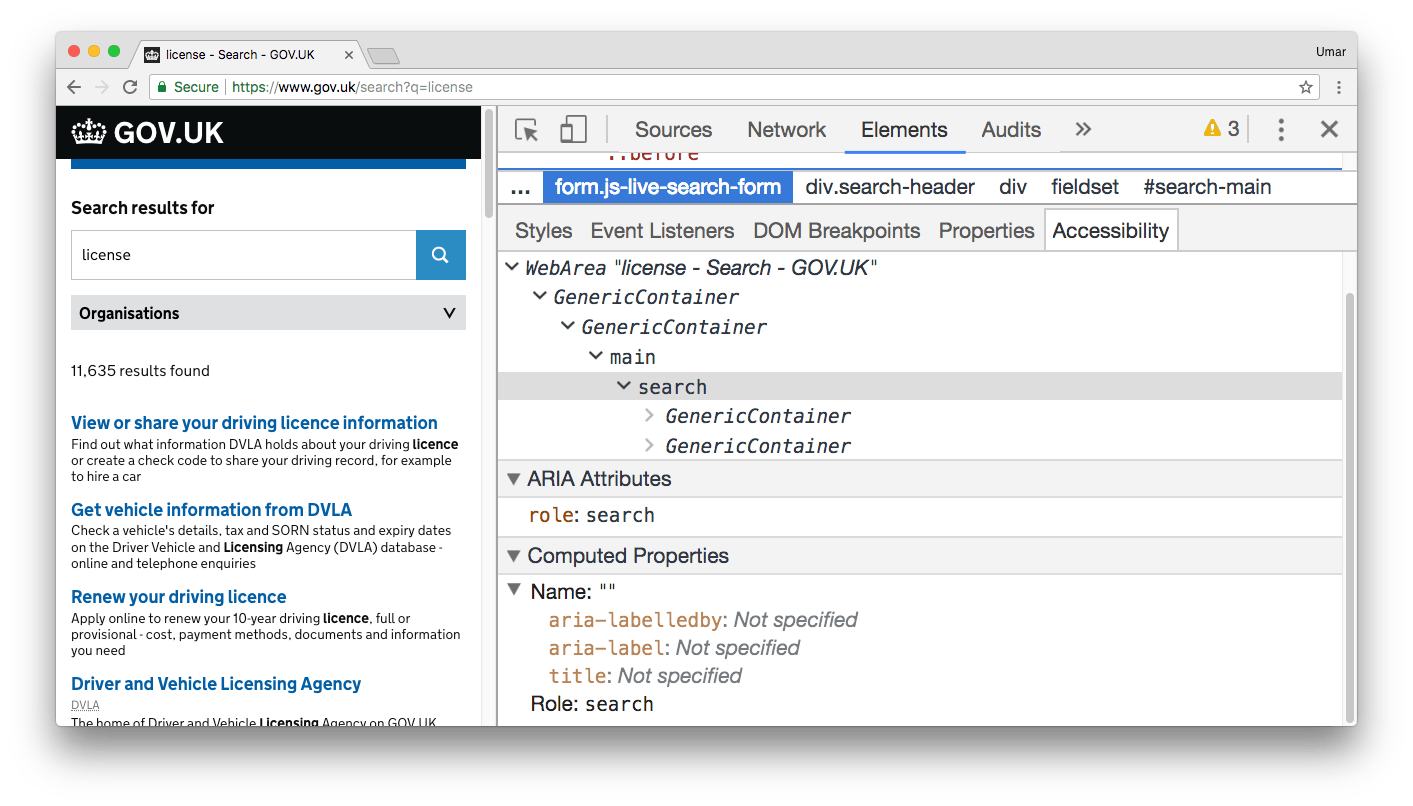
The a11y pane is present in the Elements Panel. It displays the full a11y tree (similar to a DOM tree) and presents to you related a11y properties (like ARIA attributes) within the pane.
Accessibility audits
The a11y audit can be run from the Audits panel.

After running an a11y audit on your page, you can see which audit rules you have passed and failed. A11y audit rules include those such as:
- Images must have alternate text
- Page must have a way to bypass repeated blocks of content
- Zooming and scaling must not be disabled (2x)
Conclusion
This lesson gave an overview of:
- The contrast line ratio feature within the colour tool.
- The built-in a11y pane which displays the a11y tree for your DOM.
- The DevTools a11y audit which runs a predefined set of a11y-related rules on your page.
15. Making images lazy-load with DevTools
Lesson Details
- Lesson: 15
- Description: Using Local Overrides to add native lazy-loading to images
The goal of this lesson
To improve the performance of Dev Tips using native image lazy loading.
What we’ll cover
- Introduction
- Lazy Loading Images
- Local Overrides
- Using a Web Proxy
- Conclusion
Introduction
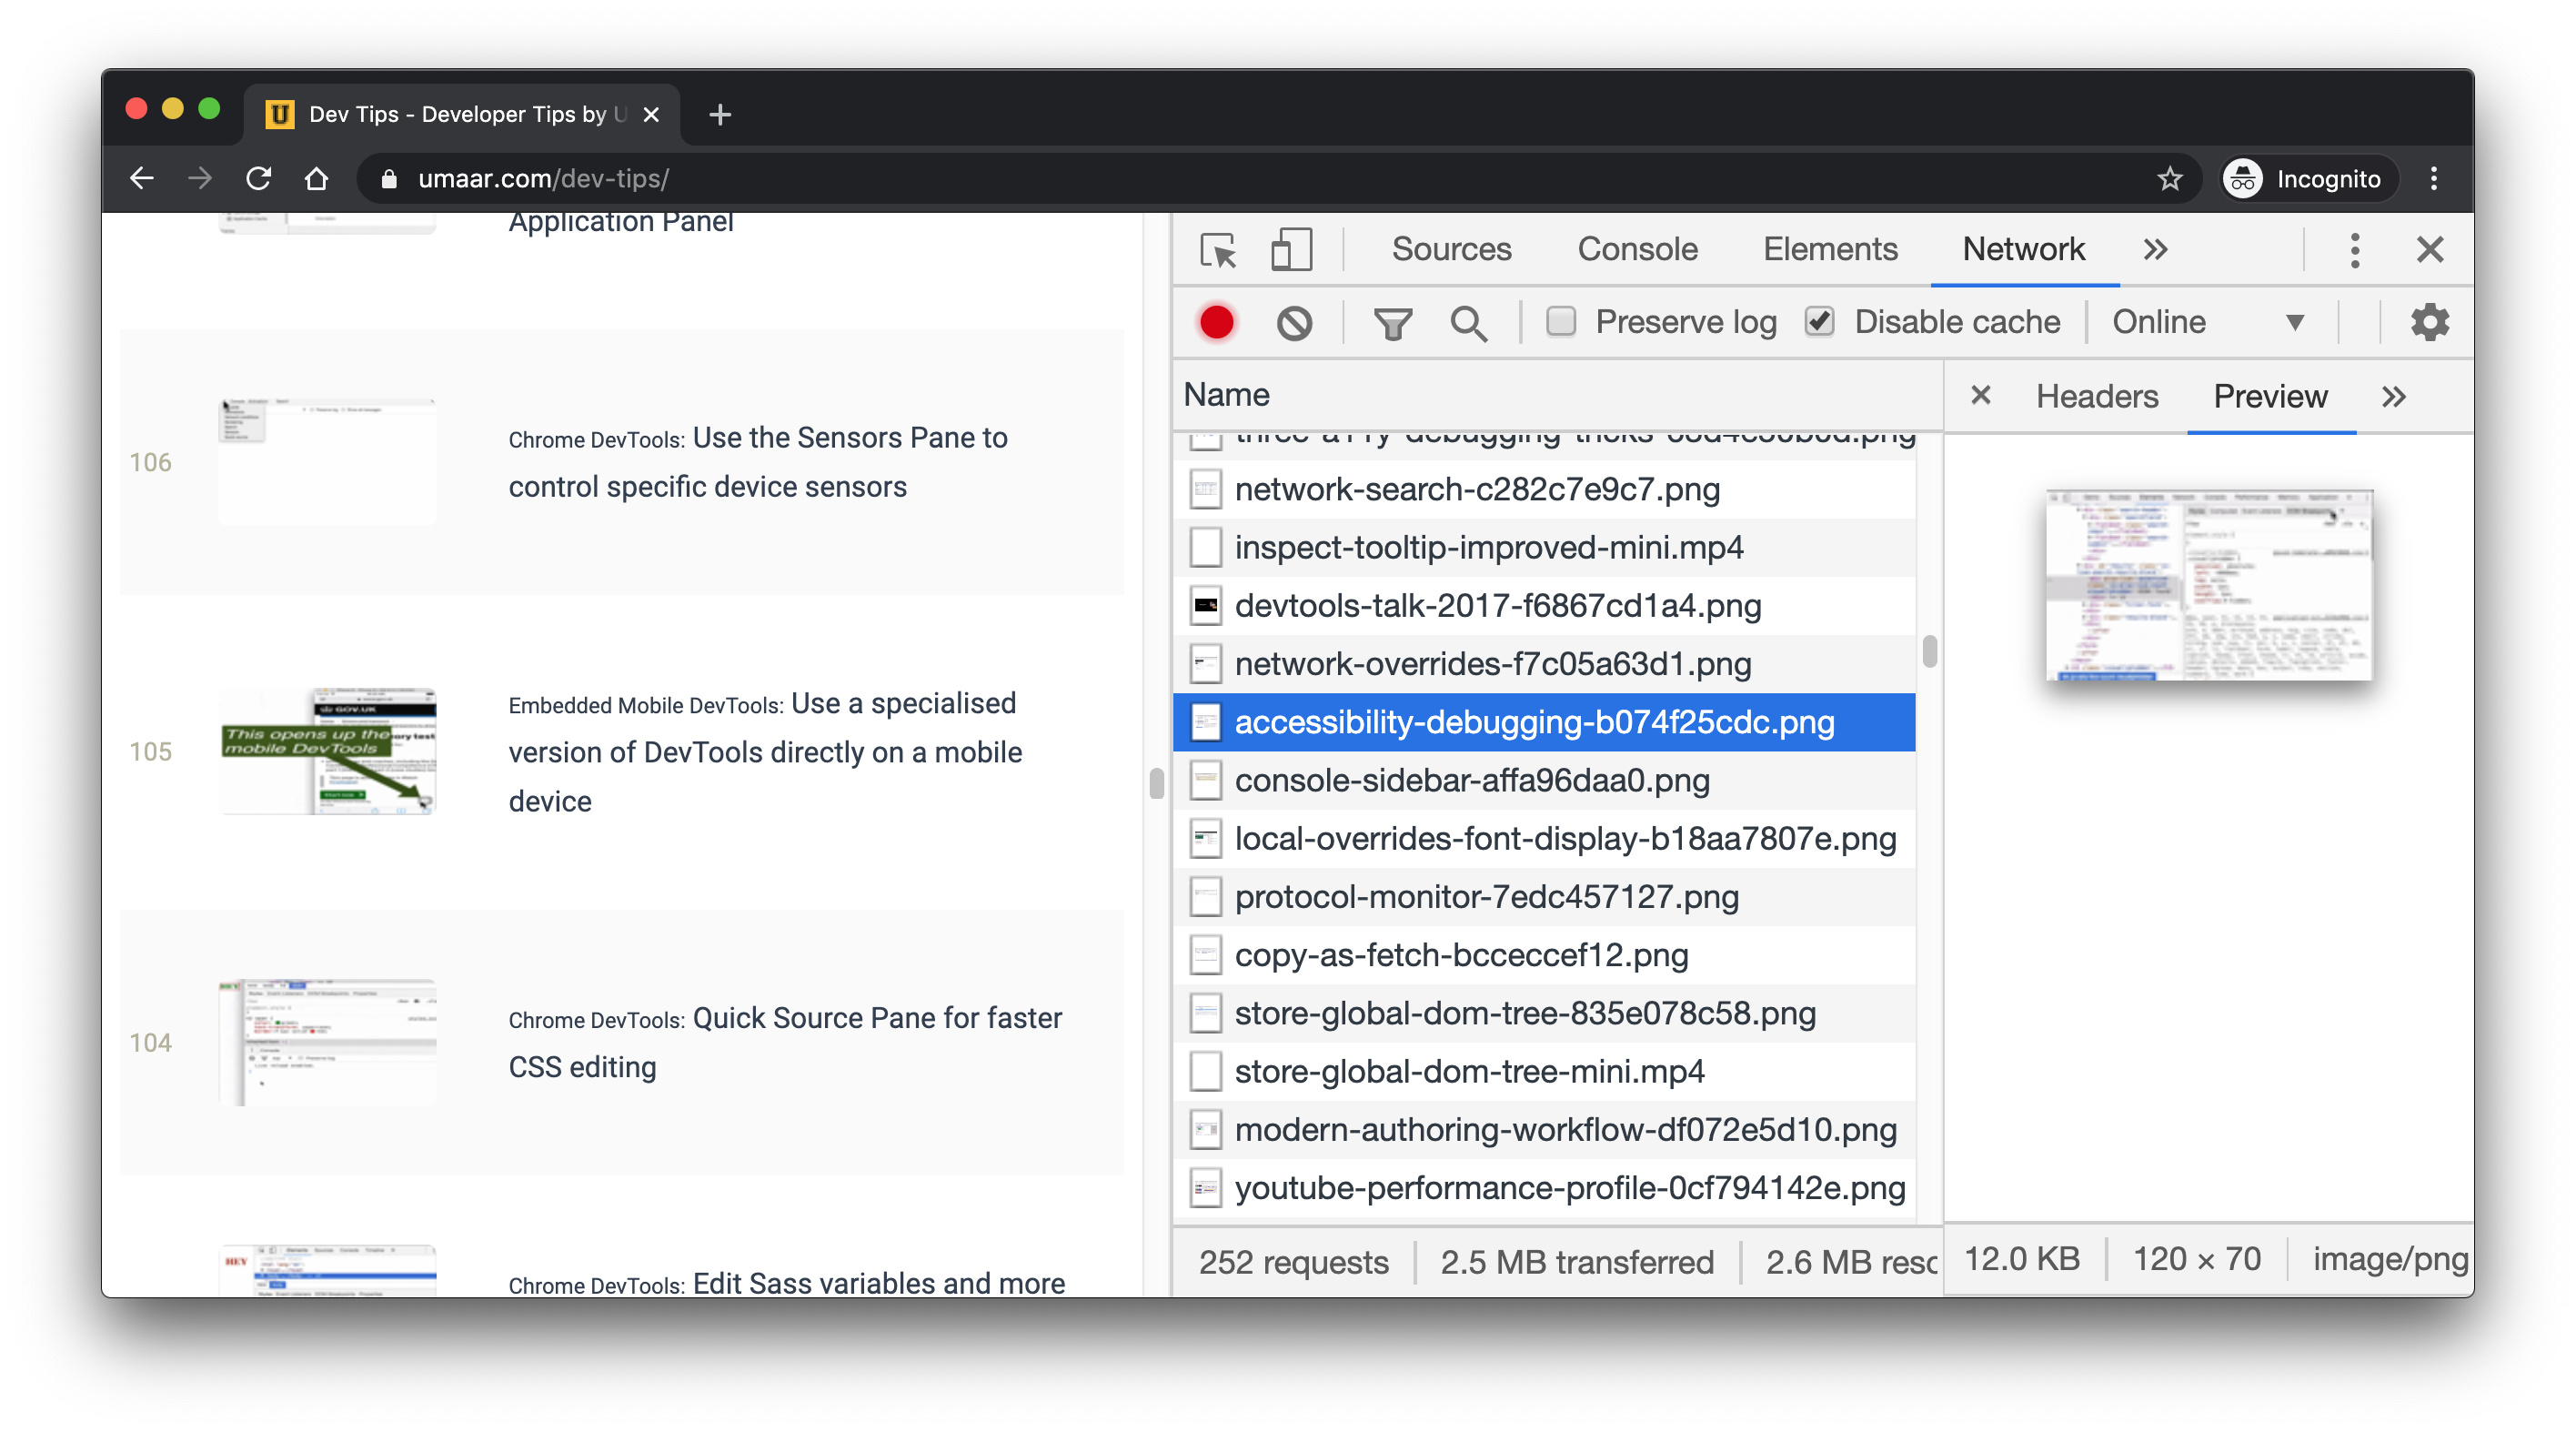
Previously, the Dev Tips landing page loaded many thumbnail images on page load. These images were not lazily loaded.
Lazy Loading Images
A search for mdn lazy loading eventually takes us here which explains the lazy loading syntax:
<img src="image.jpg" loading="lazy" alt="..." />
Local Overrides
You can configure Local Overrides in DevTools to support this workflow:
- Given a production-grade website, enable Local Overrides.
- Override the HTML so that the
<img>tags are updated with theloading="lazy"attribute and value. - Record a Network Profile of the overridden page to confirm only images within, or very close to the viewport, are loaded.
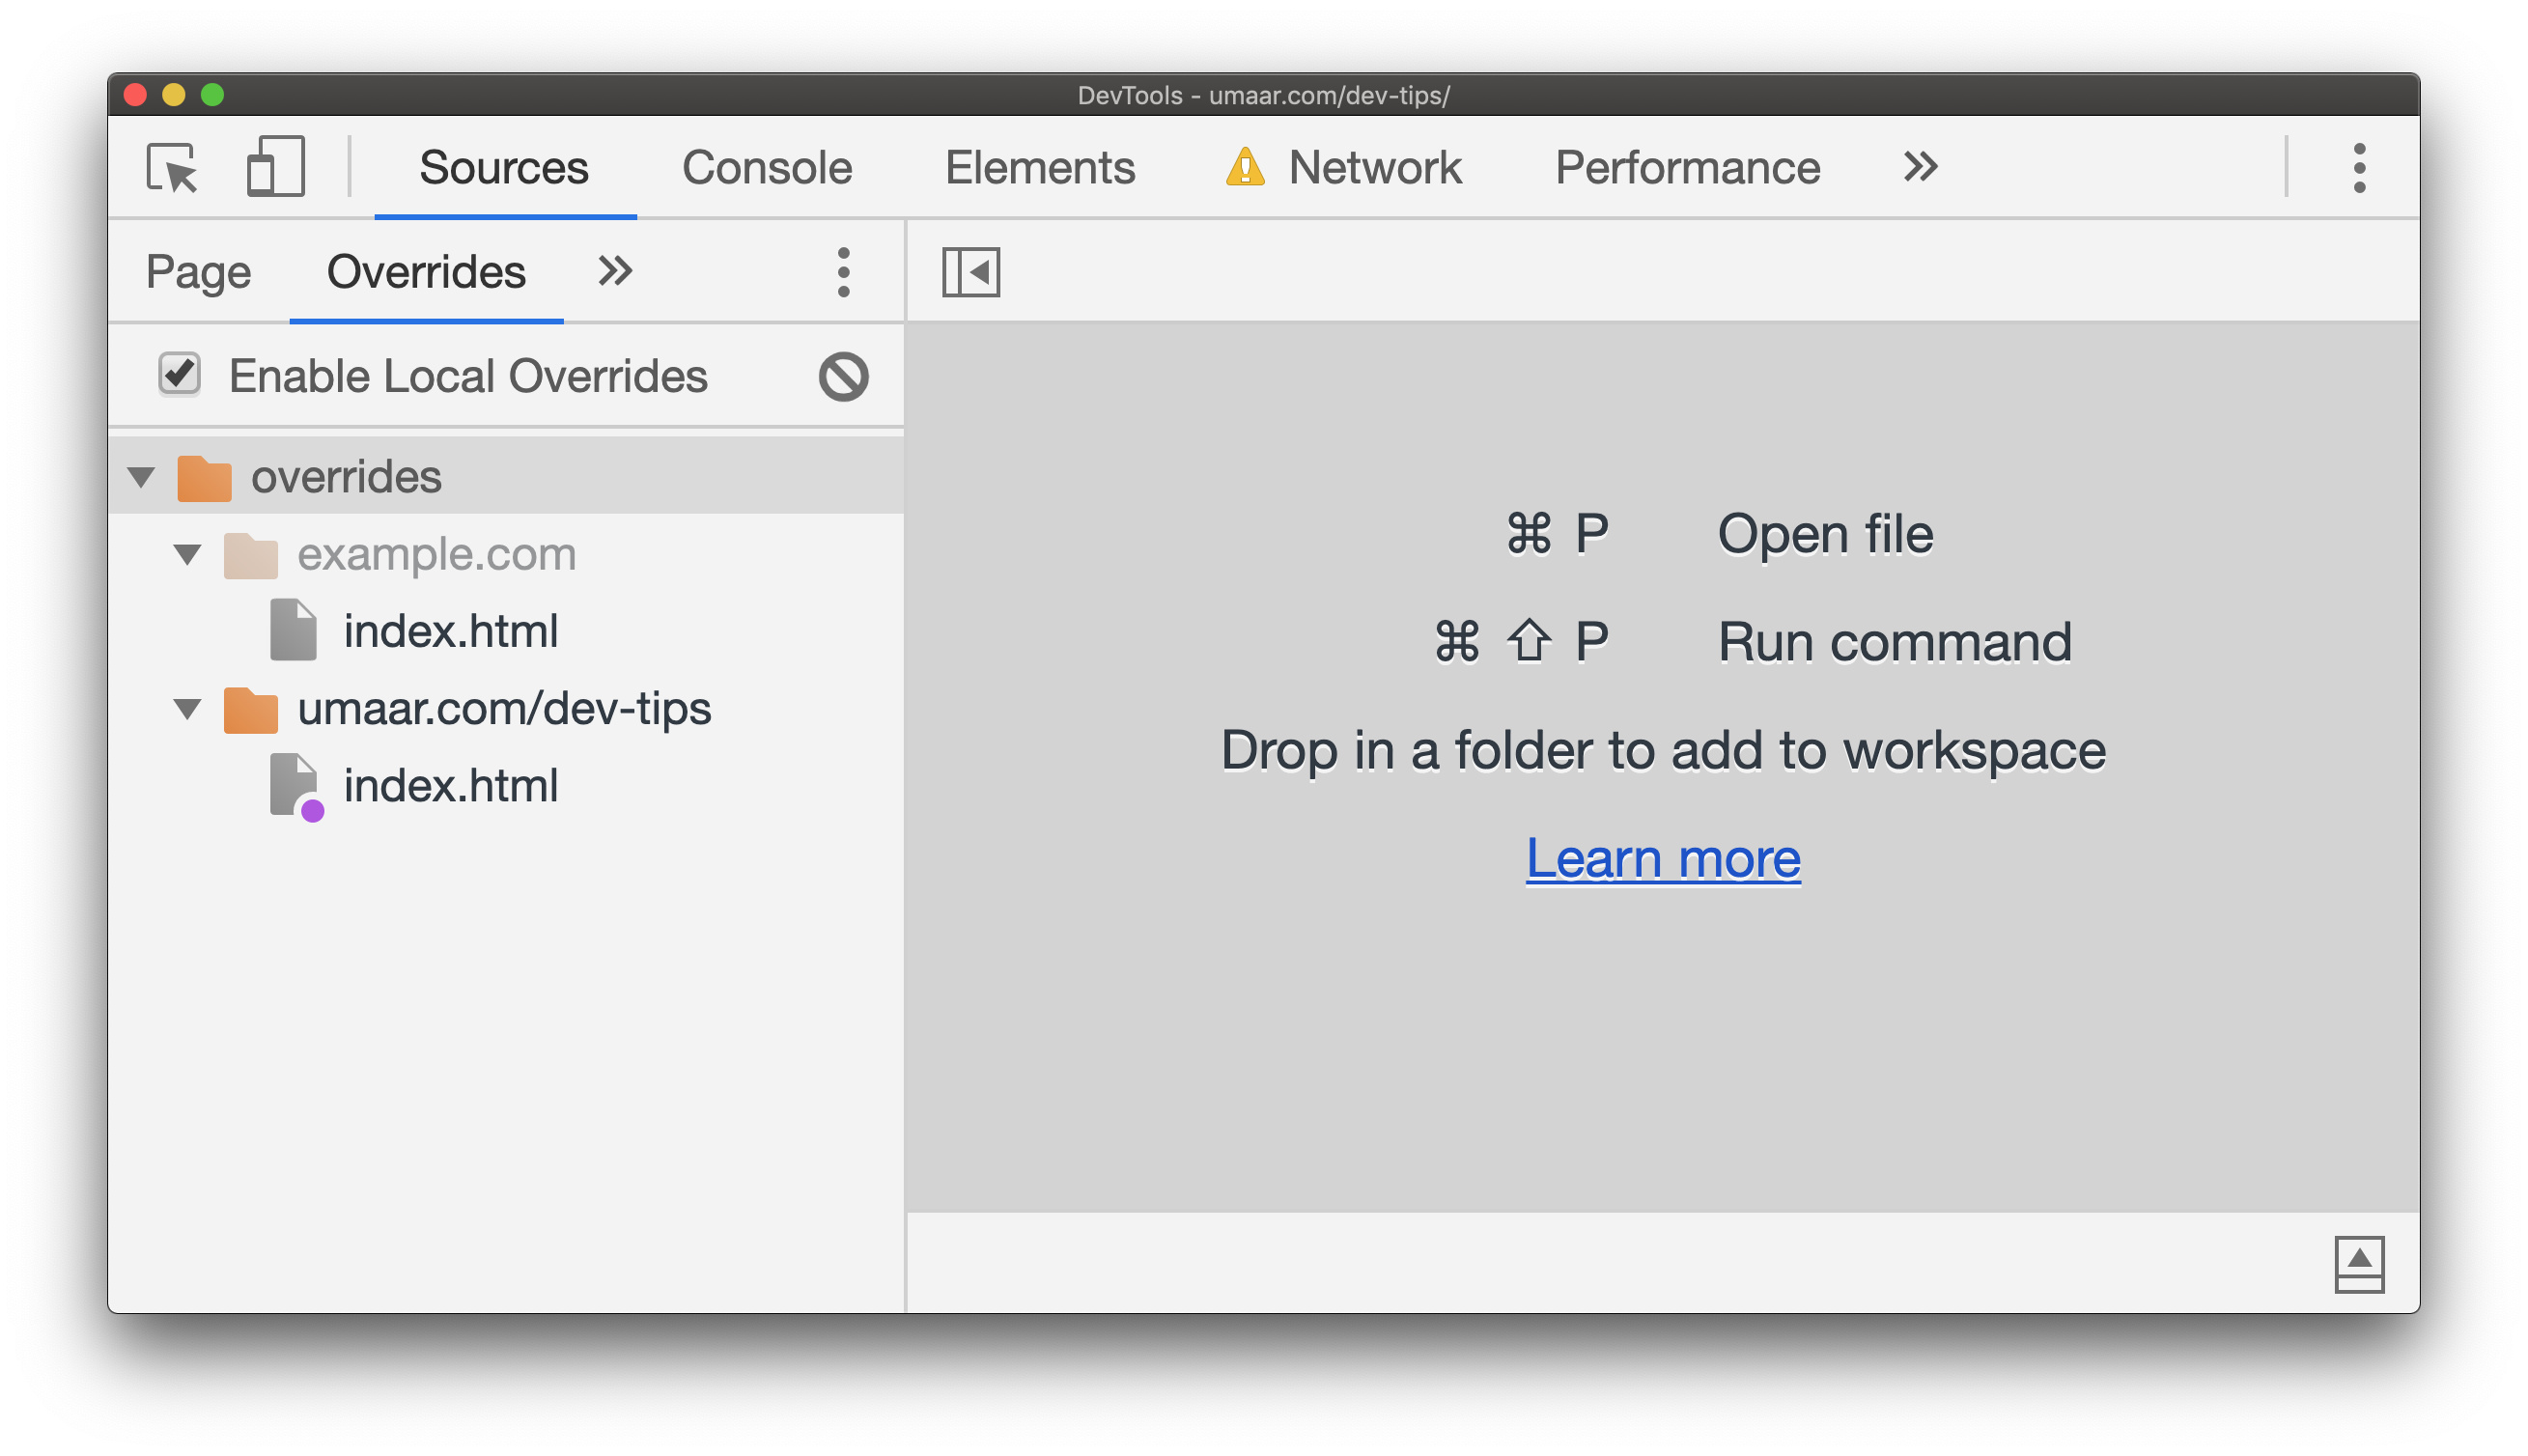
To use Local Overrides:
- Navigate to the
Overrides panein theSources Panel. - Select
Enable Local Overrides. - Select a folder on your filesystem where DevTools can save the changes you’re making.
- Locate the resource you wish to edit in the
Page pane(still within theSources Panel). - Edit the resource and save with
Cmd + S/Ctrl + S. - Reload your webpage, and observe your local resource is being used instead of the remote resource.
Using a Web Proxy
Various web proxy solutions can be installed on your machines to intercept requests, and serve a completely different resource - one which lives on your desktop for example. This means you can achieve the same thing as DevTools Local Overrides, but a proxy version will be compatible across all browsers, and also supports modifying requests and responses.
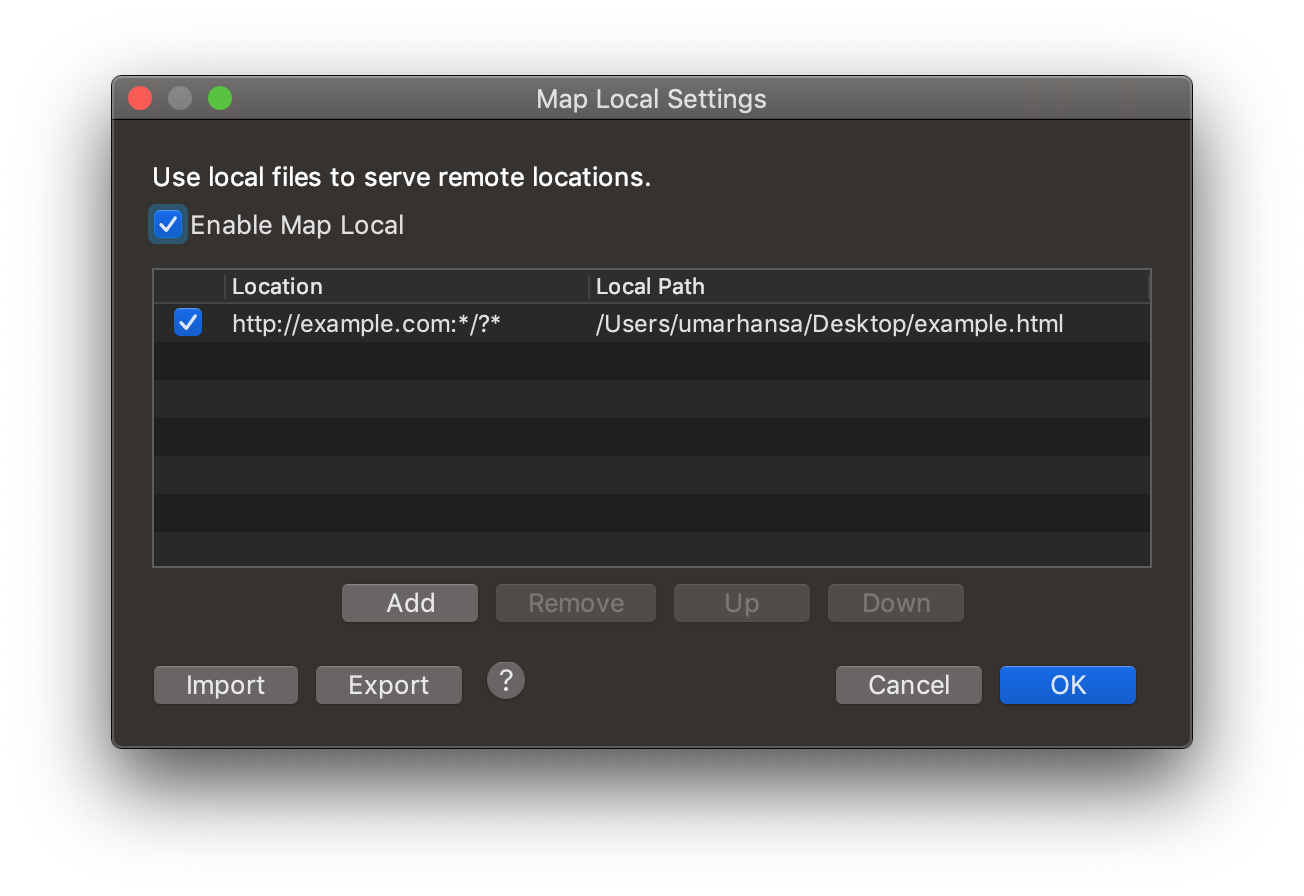
The Screenshot above comes from a tool known as Charles Proxy. HTTP & HTTPS interception is possible, and you can also point your mobile phone to the proxy installed on your machine, meaning overrides via a Proxy can be done on your phone too.
Conclusion
Local Overrides in DevTools offers a quick and easy way to map remote resources onto local resources, so you can prototype website variations, and performance profile them to verify they work.
16. Exploring the render Performance of the National Rail website
Lesson Details
- Lesson: 16
- Description: Using the Layers Panel to Diagnose Performance issues
The goal of this lesson
To improve the performance of the National Rail website.
What we’ll cover
- Introduction
- Performance Profiling
- Layers Panel
- Changing the z-index
- Conclusion
Introduction
The National Rail website occasionally uses an ad which has some interesting performance implications. This version is hosted at nationalrail.umaar.now.sh, as the production version of the site may not always present such behaviour.
Performance Profiling
We can use the Performance Monitor ( Cmd + Shift + P > Show Performance Monitor ) to view a high-level overview of the National Rail website.
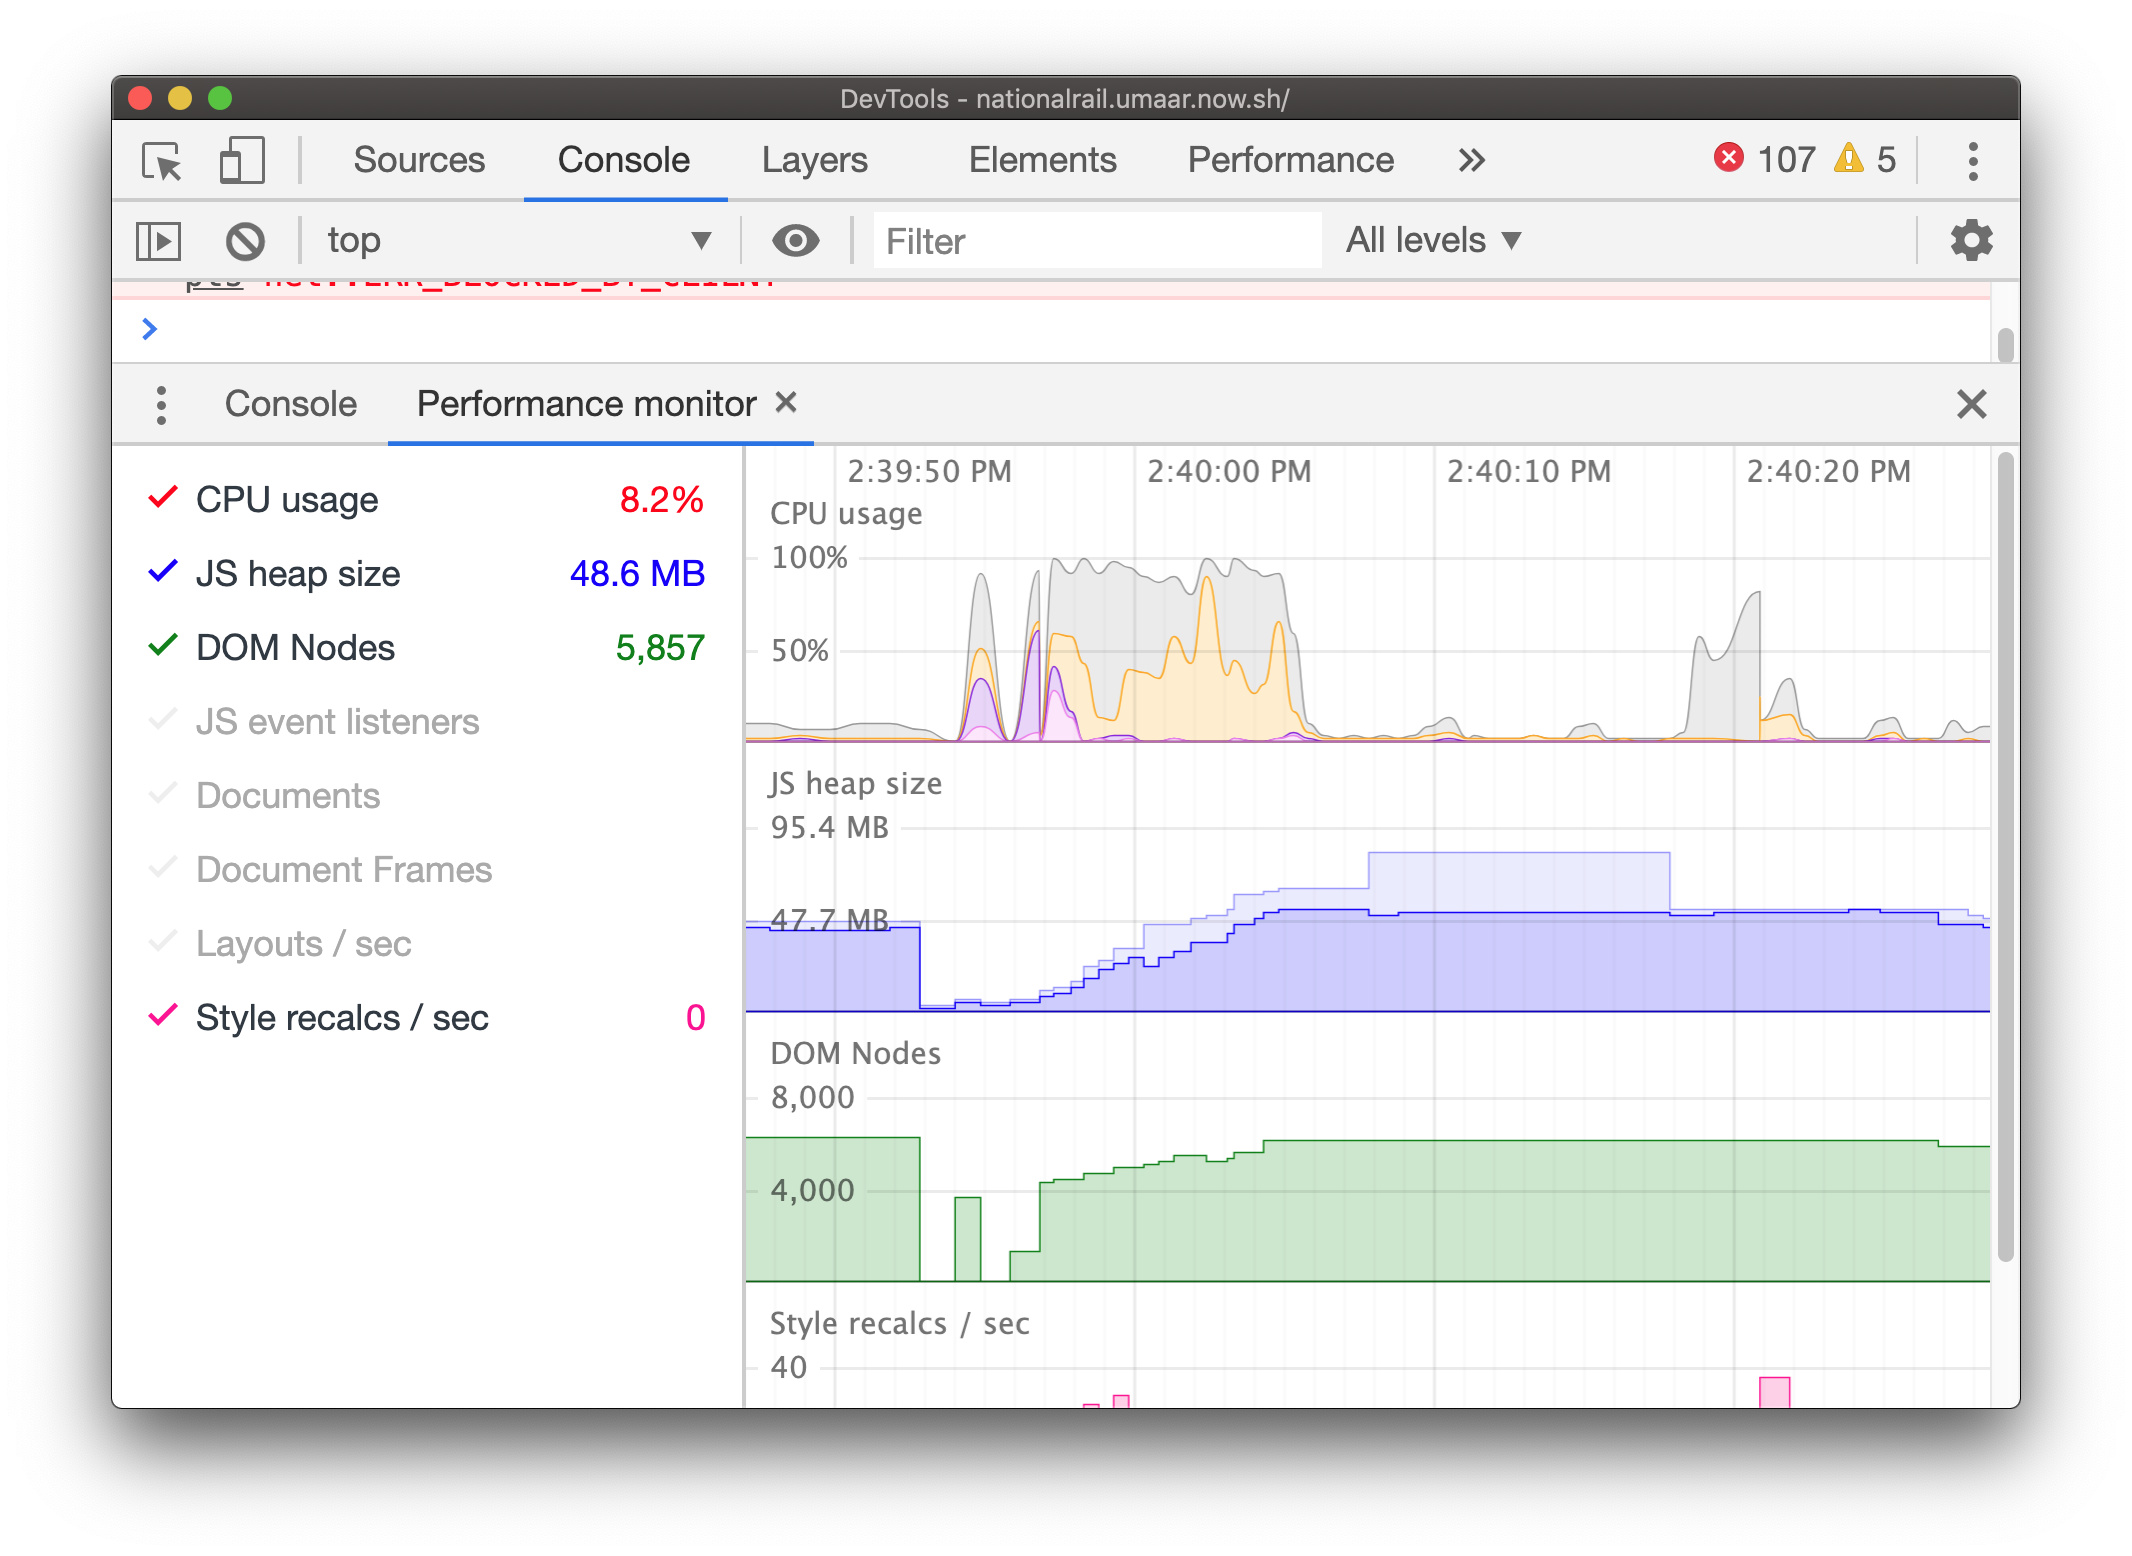
If for example, the DOM Nodes graph is spiking, this gives you a specific area on what to look at next.
You can record a performance profile in the Performance Panel, which provides much more detail than the Performance Monitor.
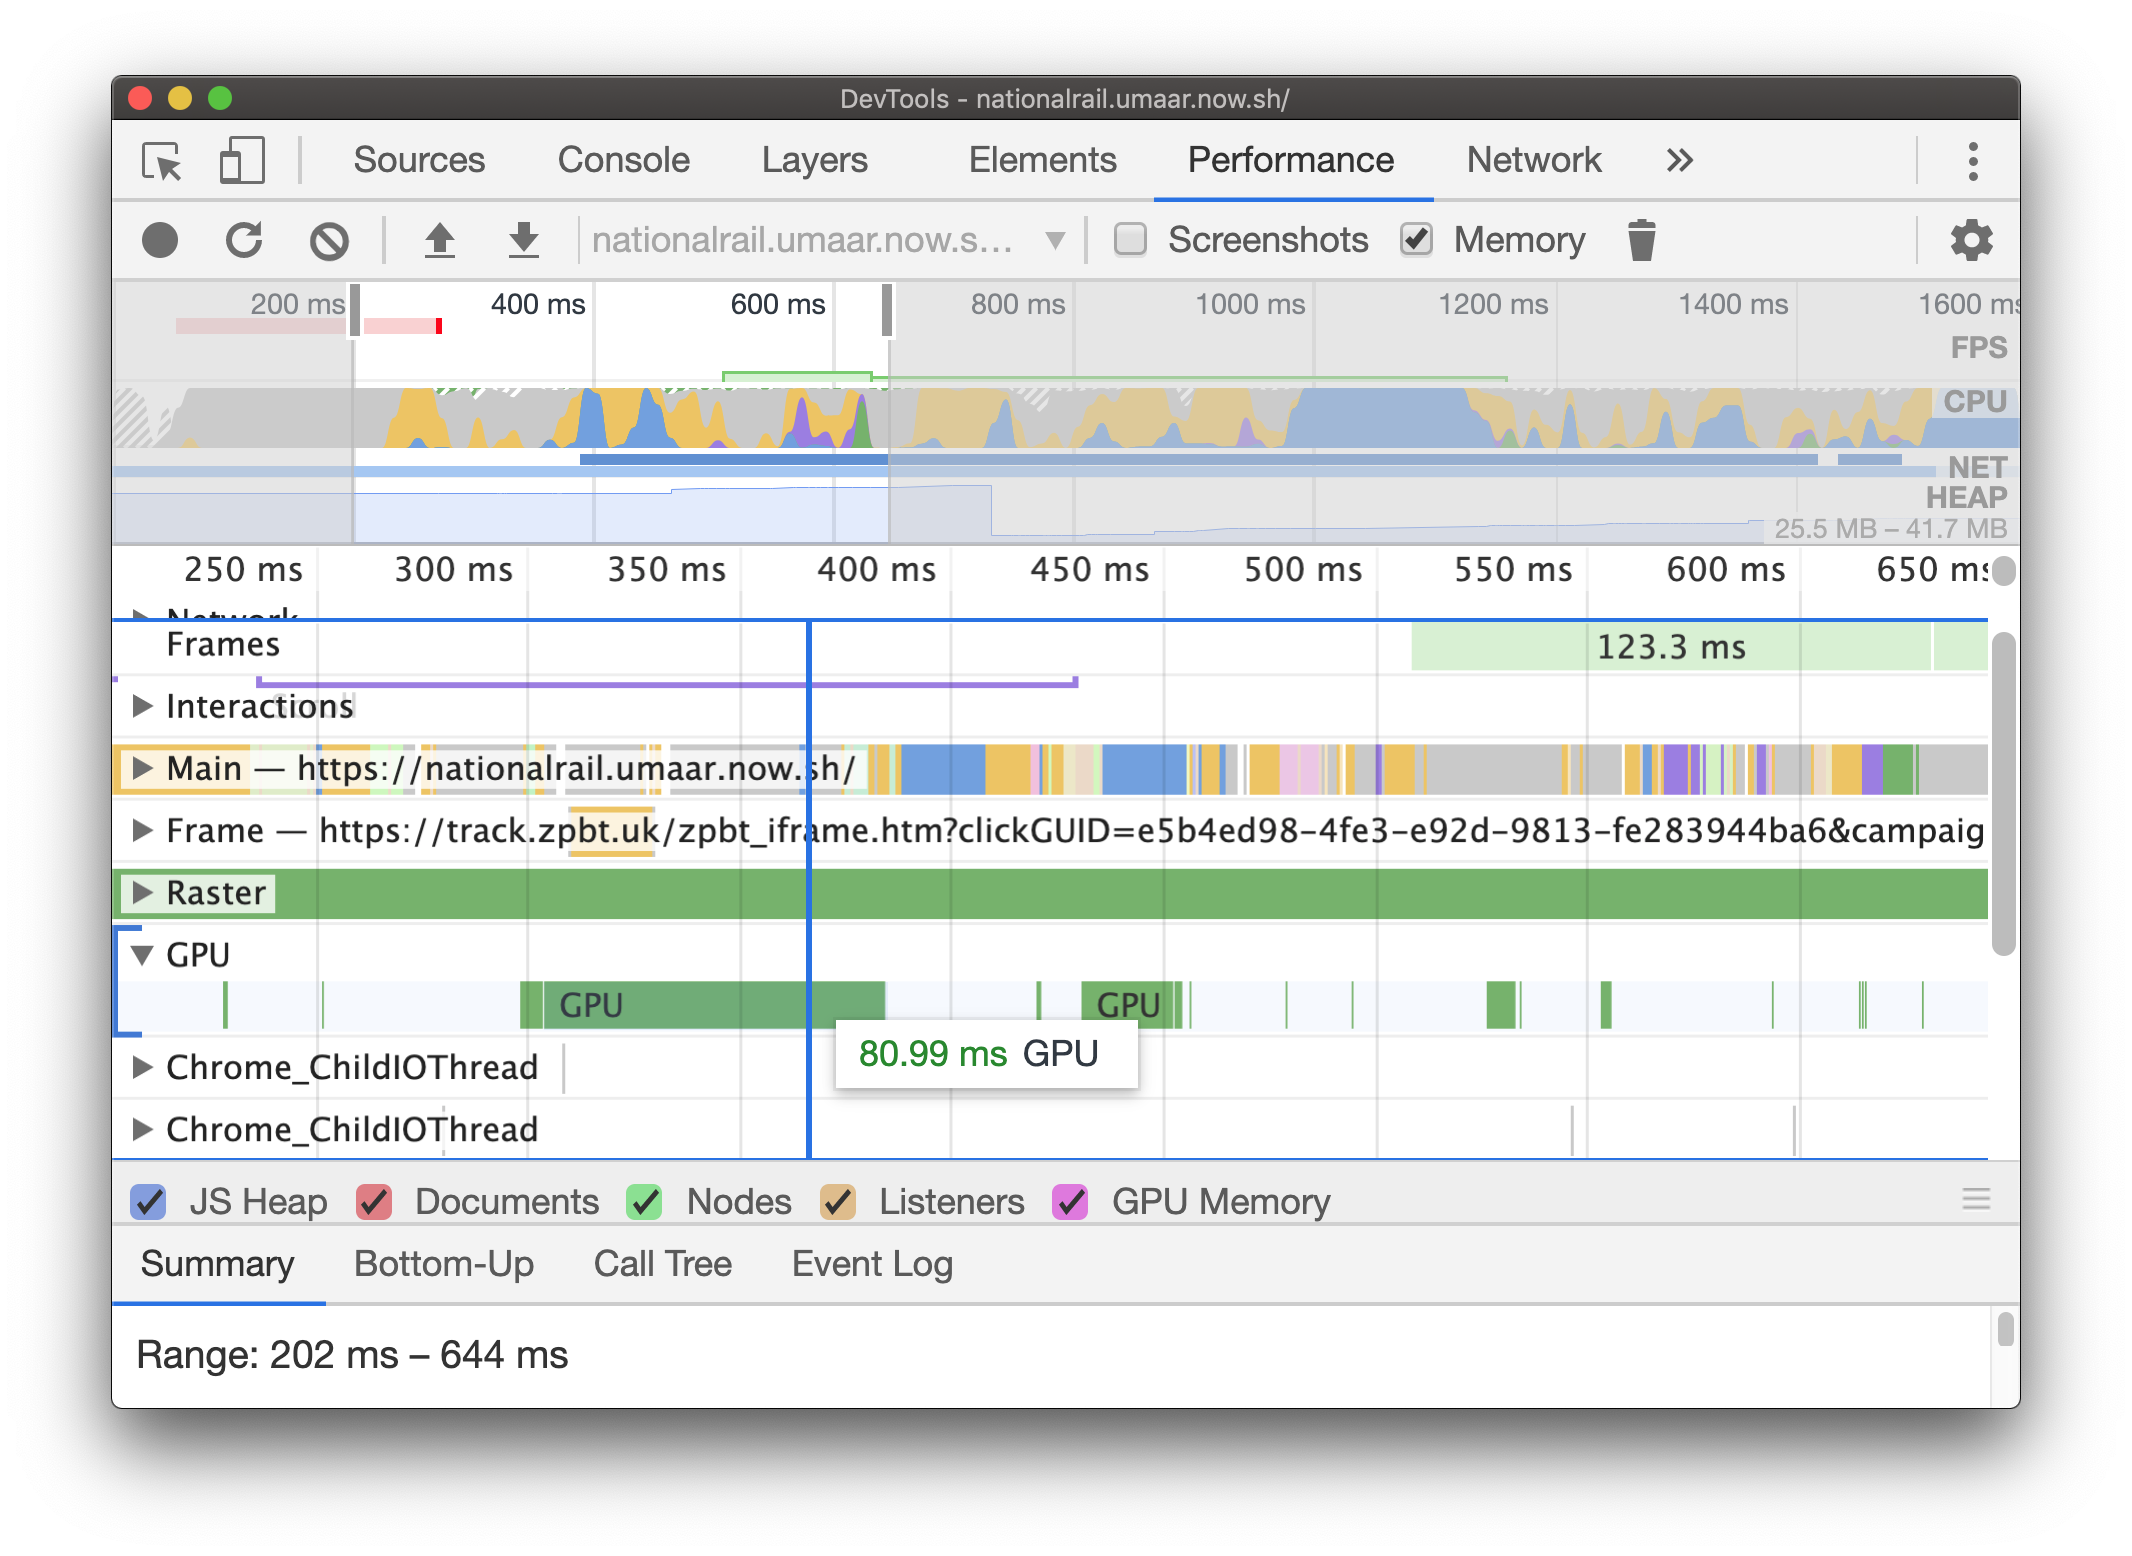
In the case of this performance recording, while the GPU events are not the slowest thing here, they’re still a little slower than expected, this prompts us to open the Layers Panel ( Cmd + Shift + P > Show Layers Panel ).
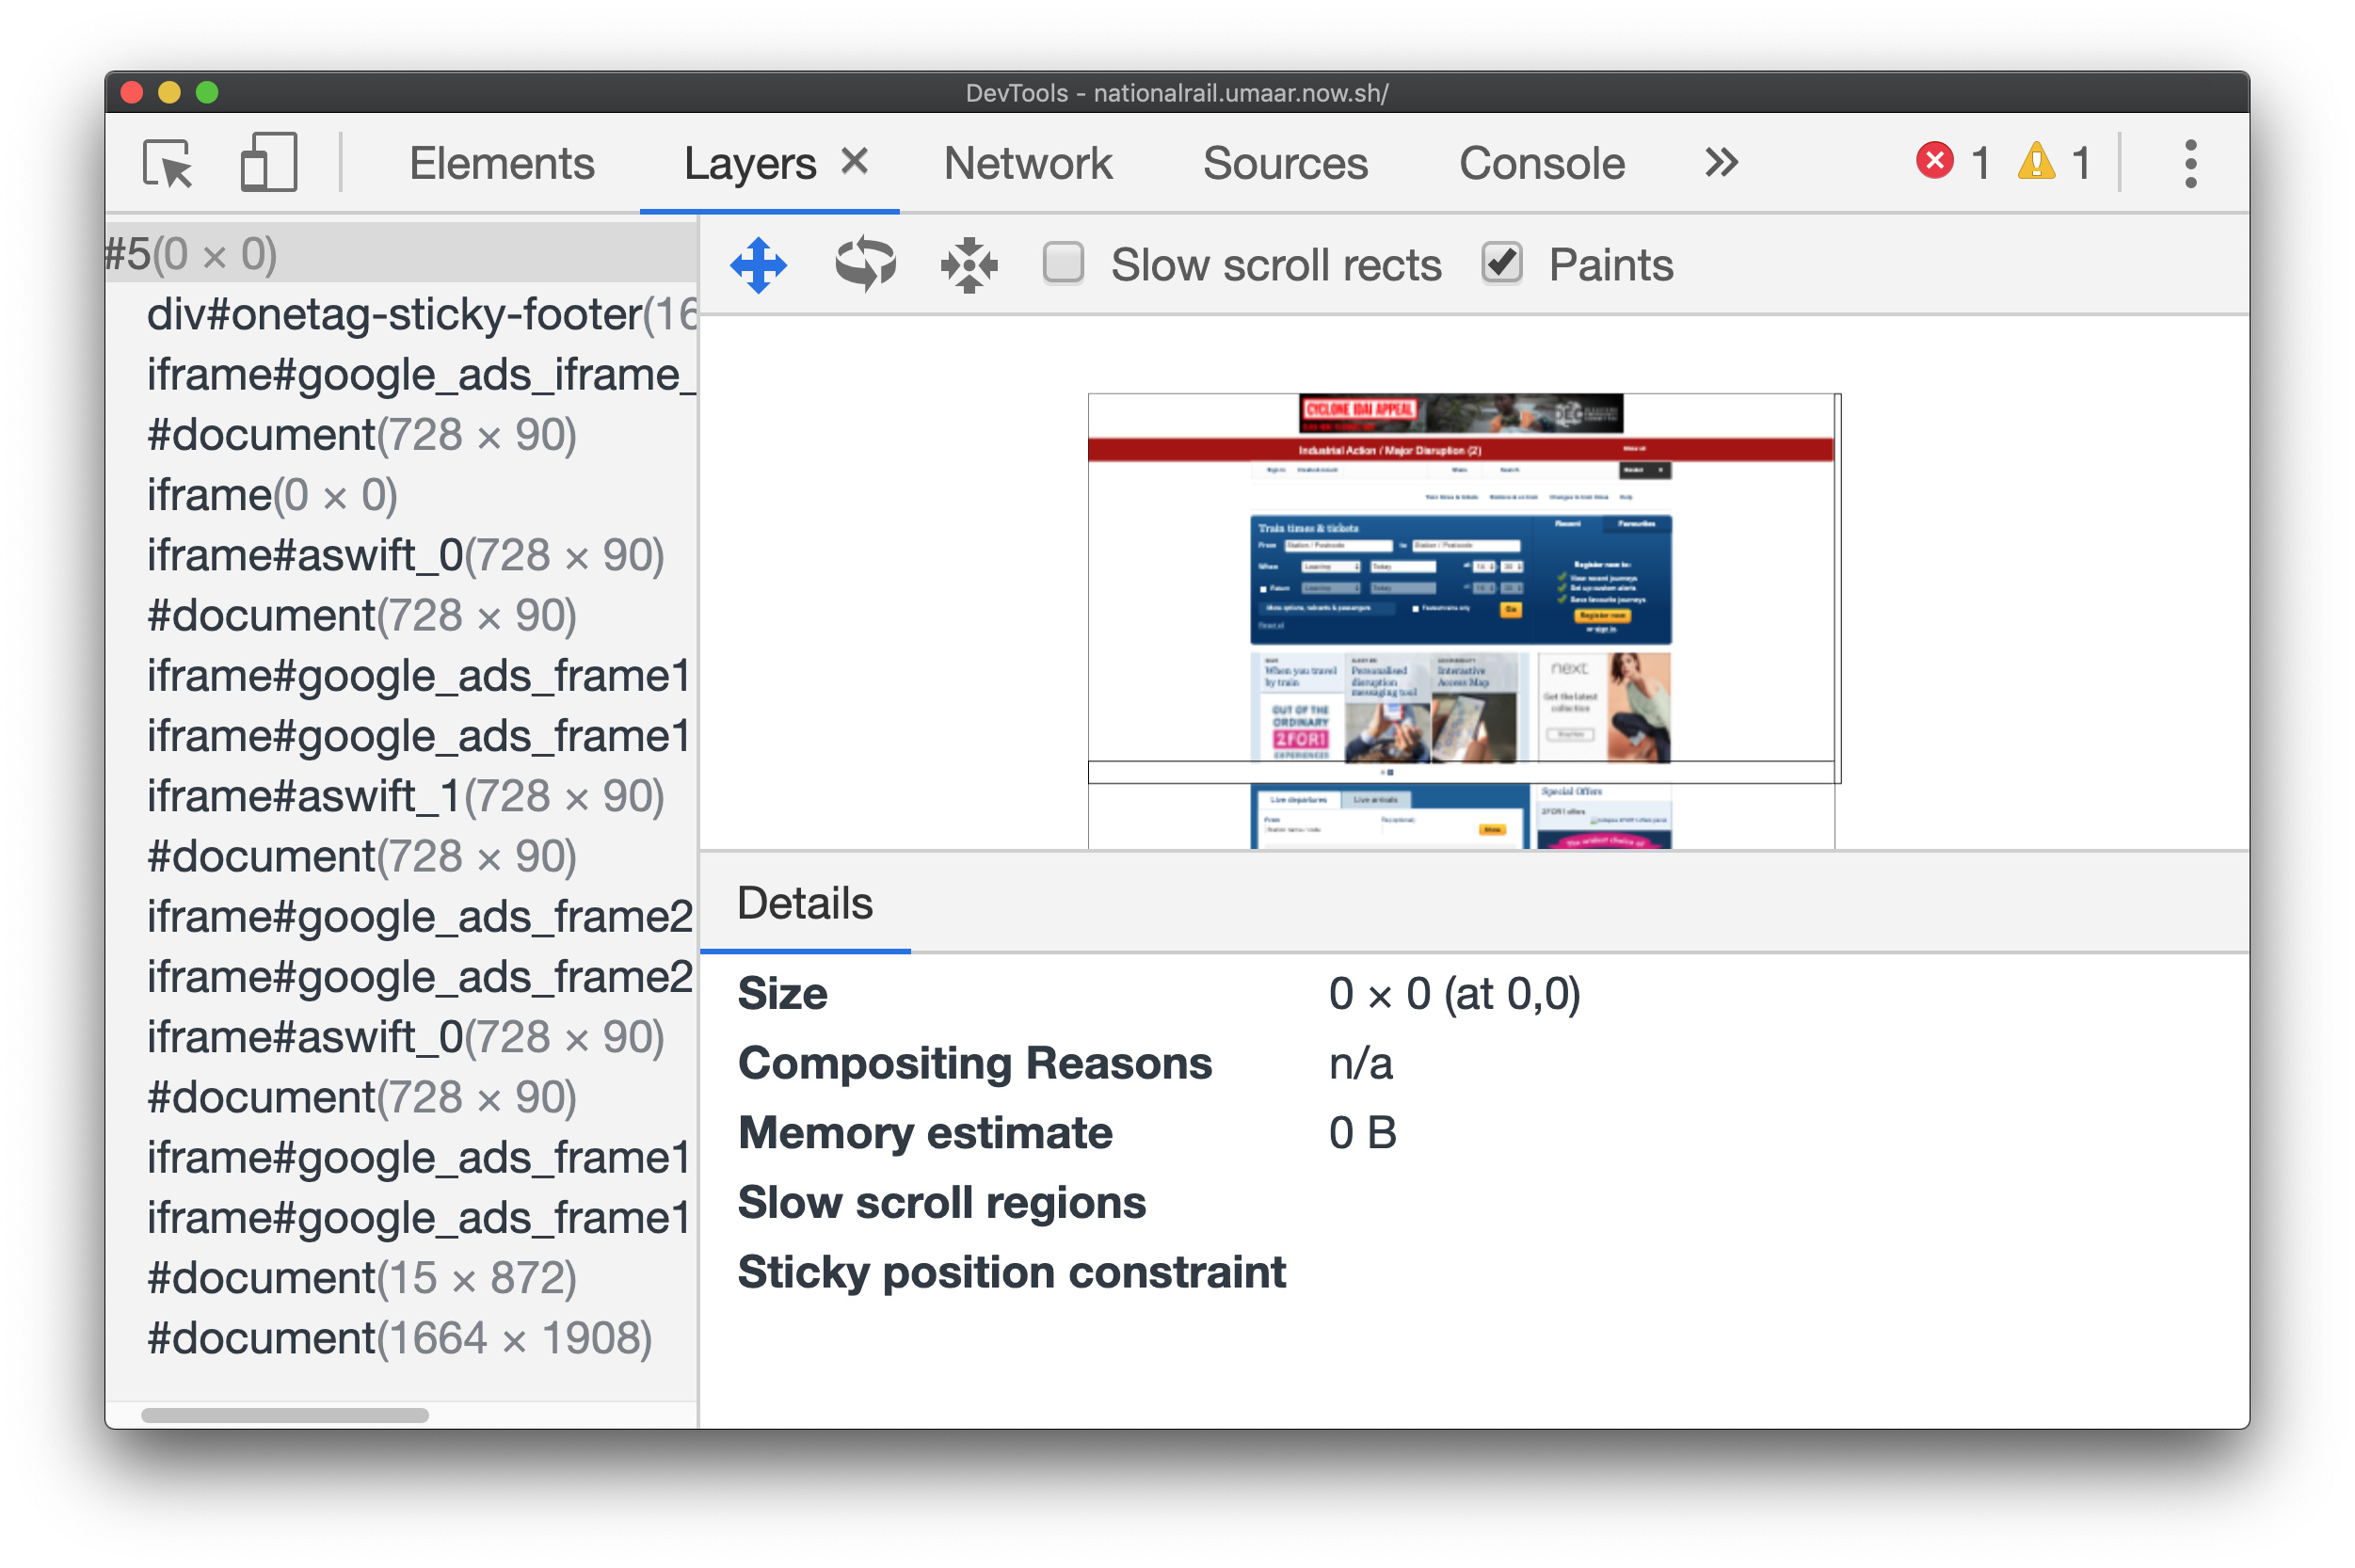
Layers Panel
The Layers Panel gives a 3D representation of the layers on the currently inspected page. On this page, there is a very large layer which DevTools estimates to need almost a gigabyte of memory.
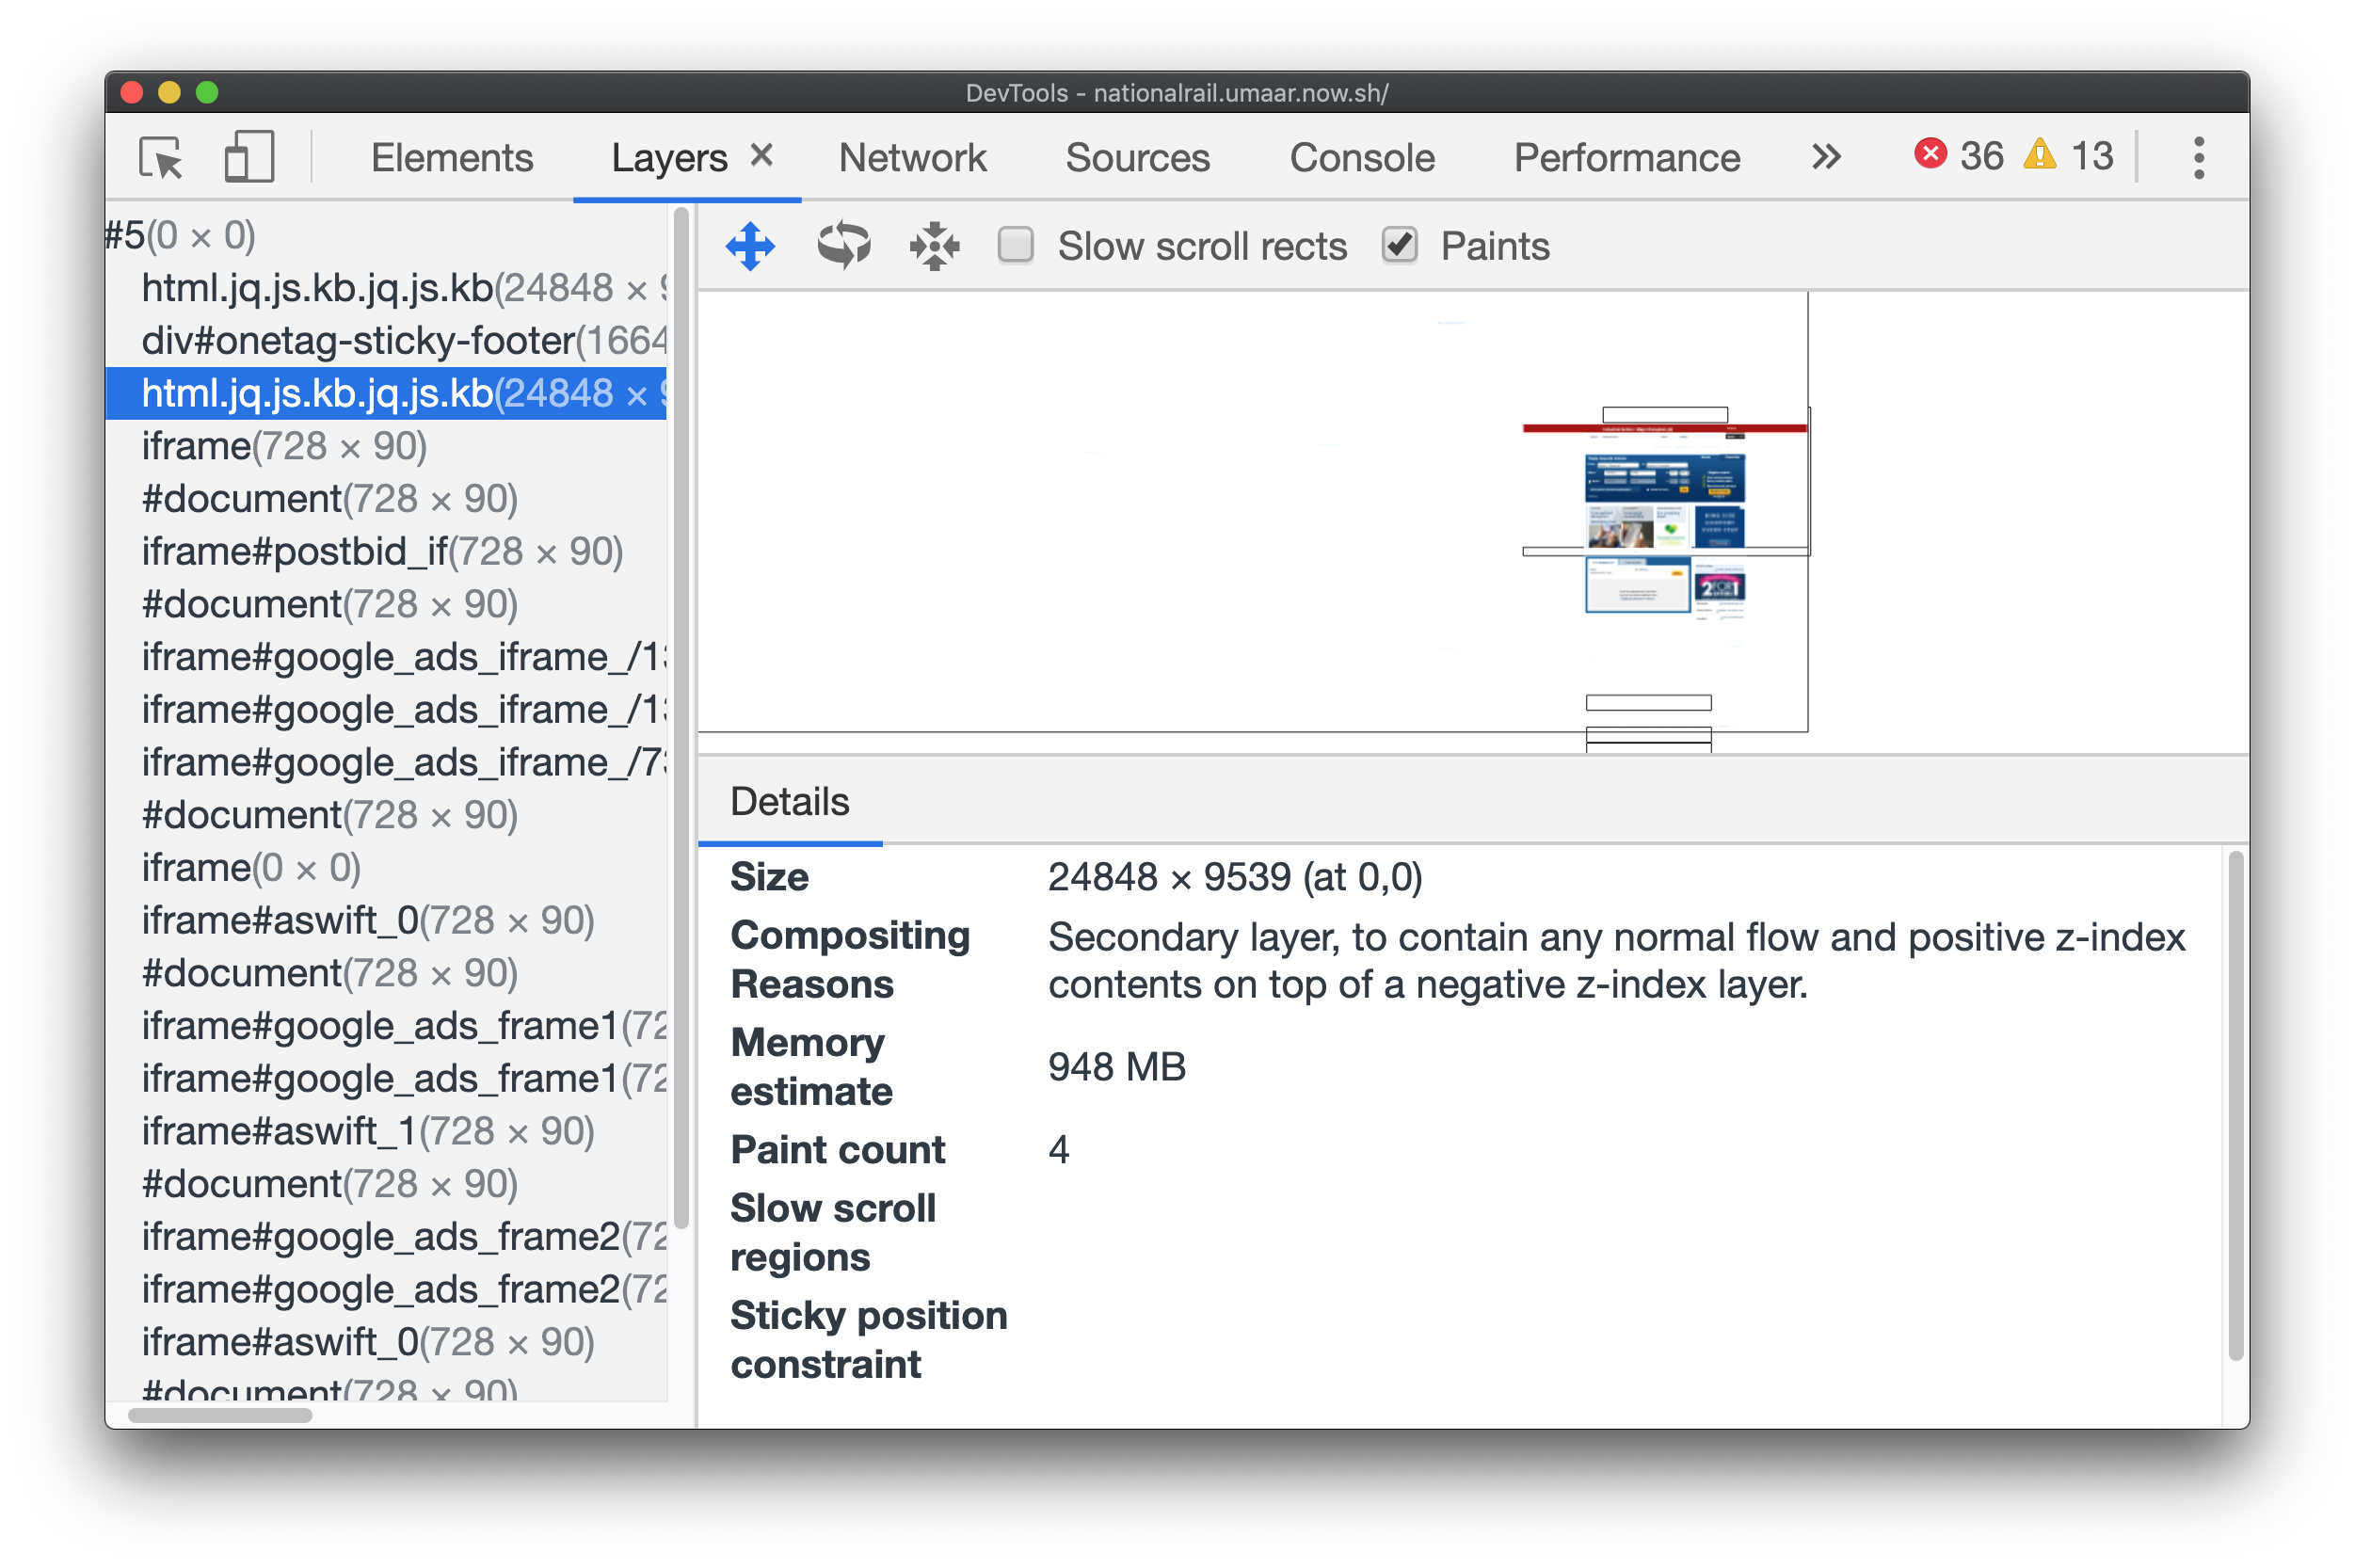
The compositing reason suggests that the parent element has children with a negative z-index , which resulted in this element being promoted to its own layer.
Changing the z-index
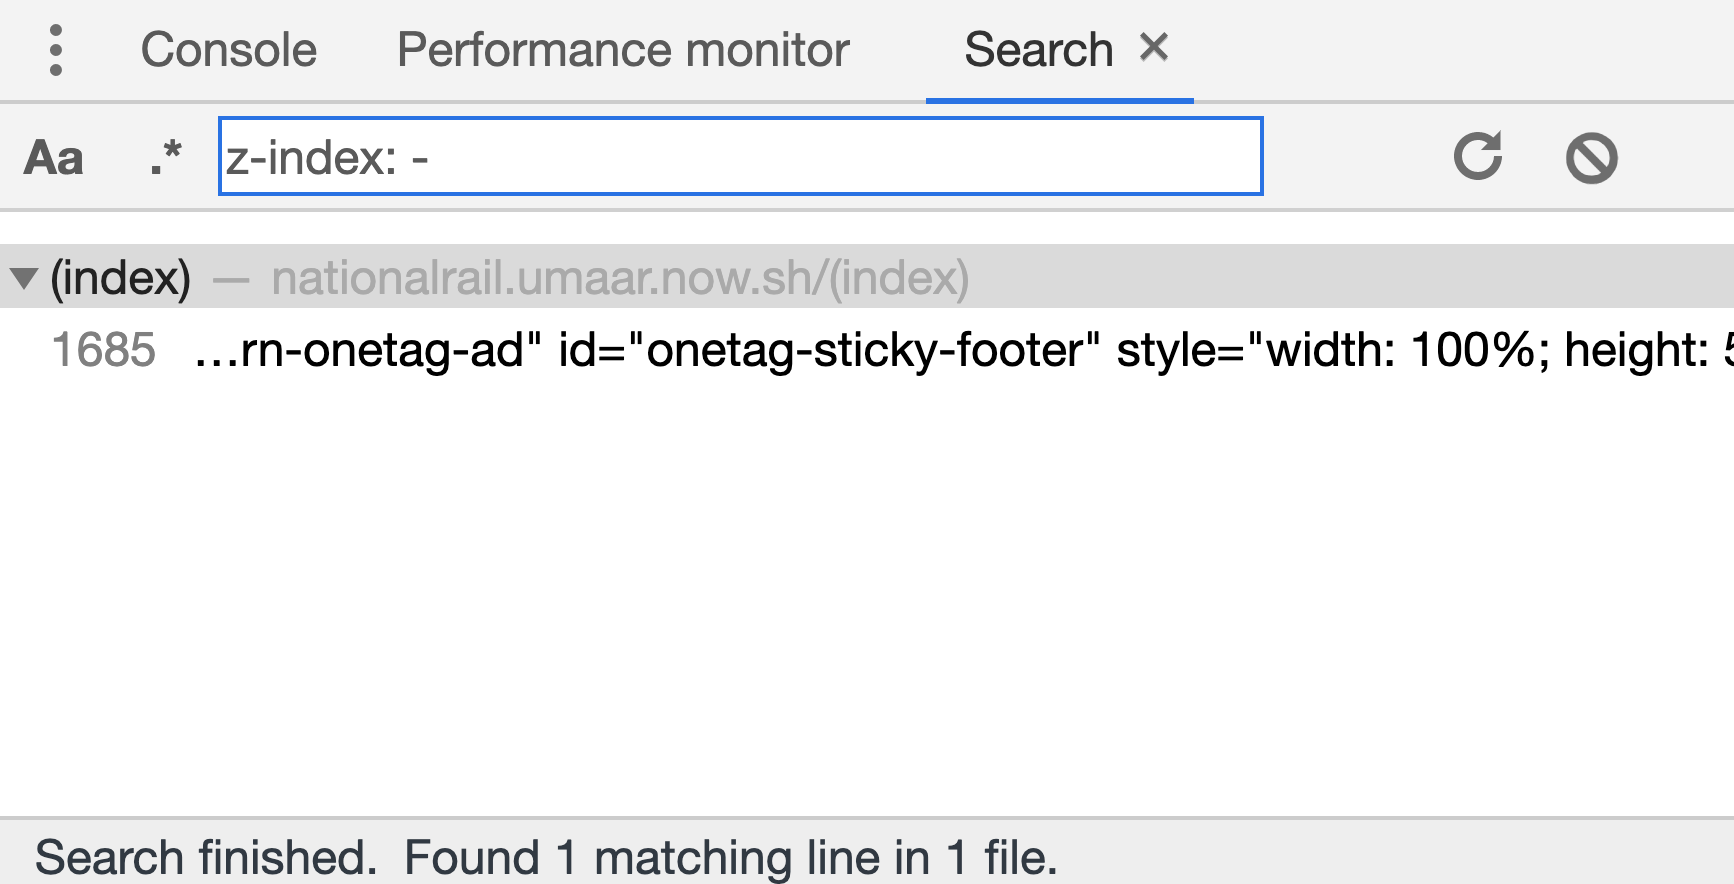
To find the element(s) with a negative z-index, we can construct a project wide search using the shortcut: Cmd + Alt + F and search for z-index: - .
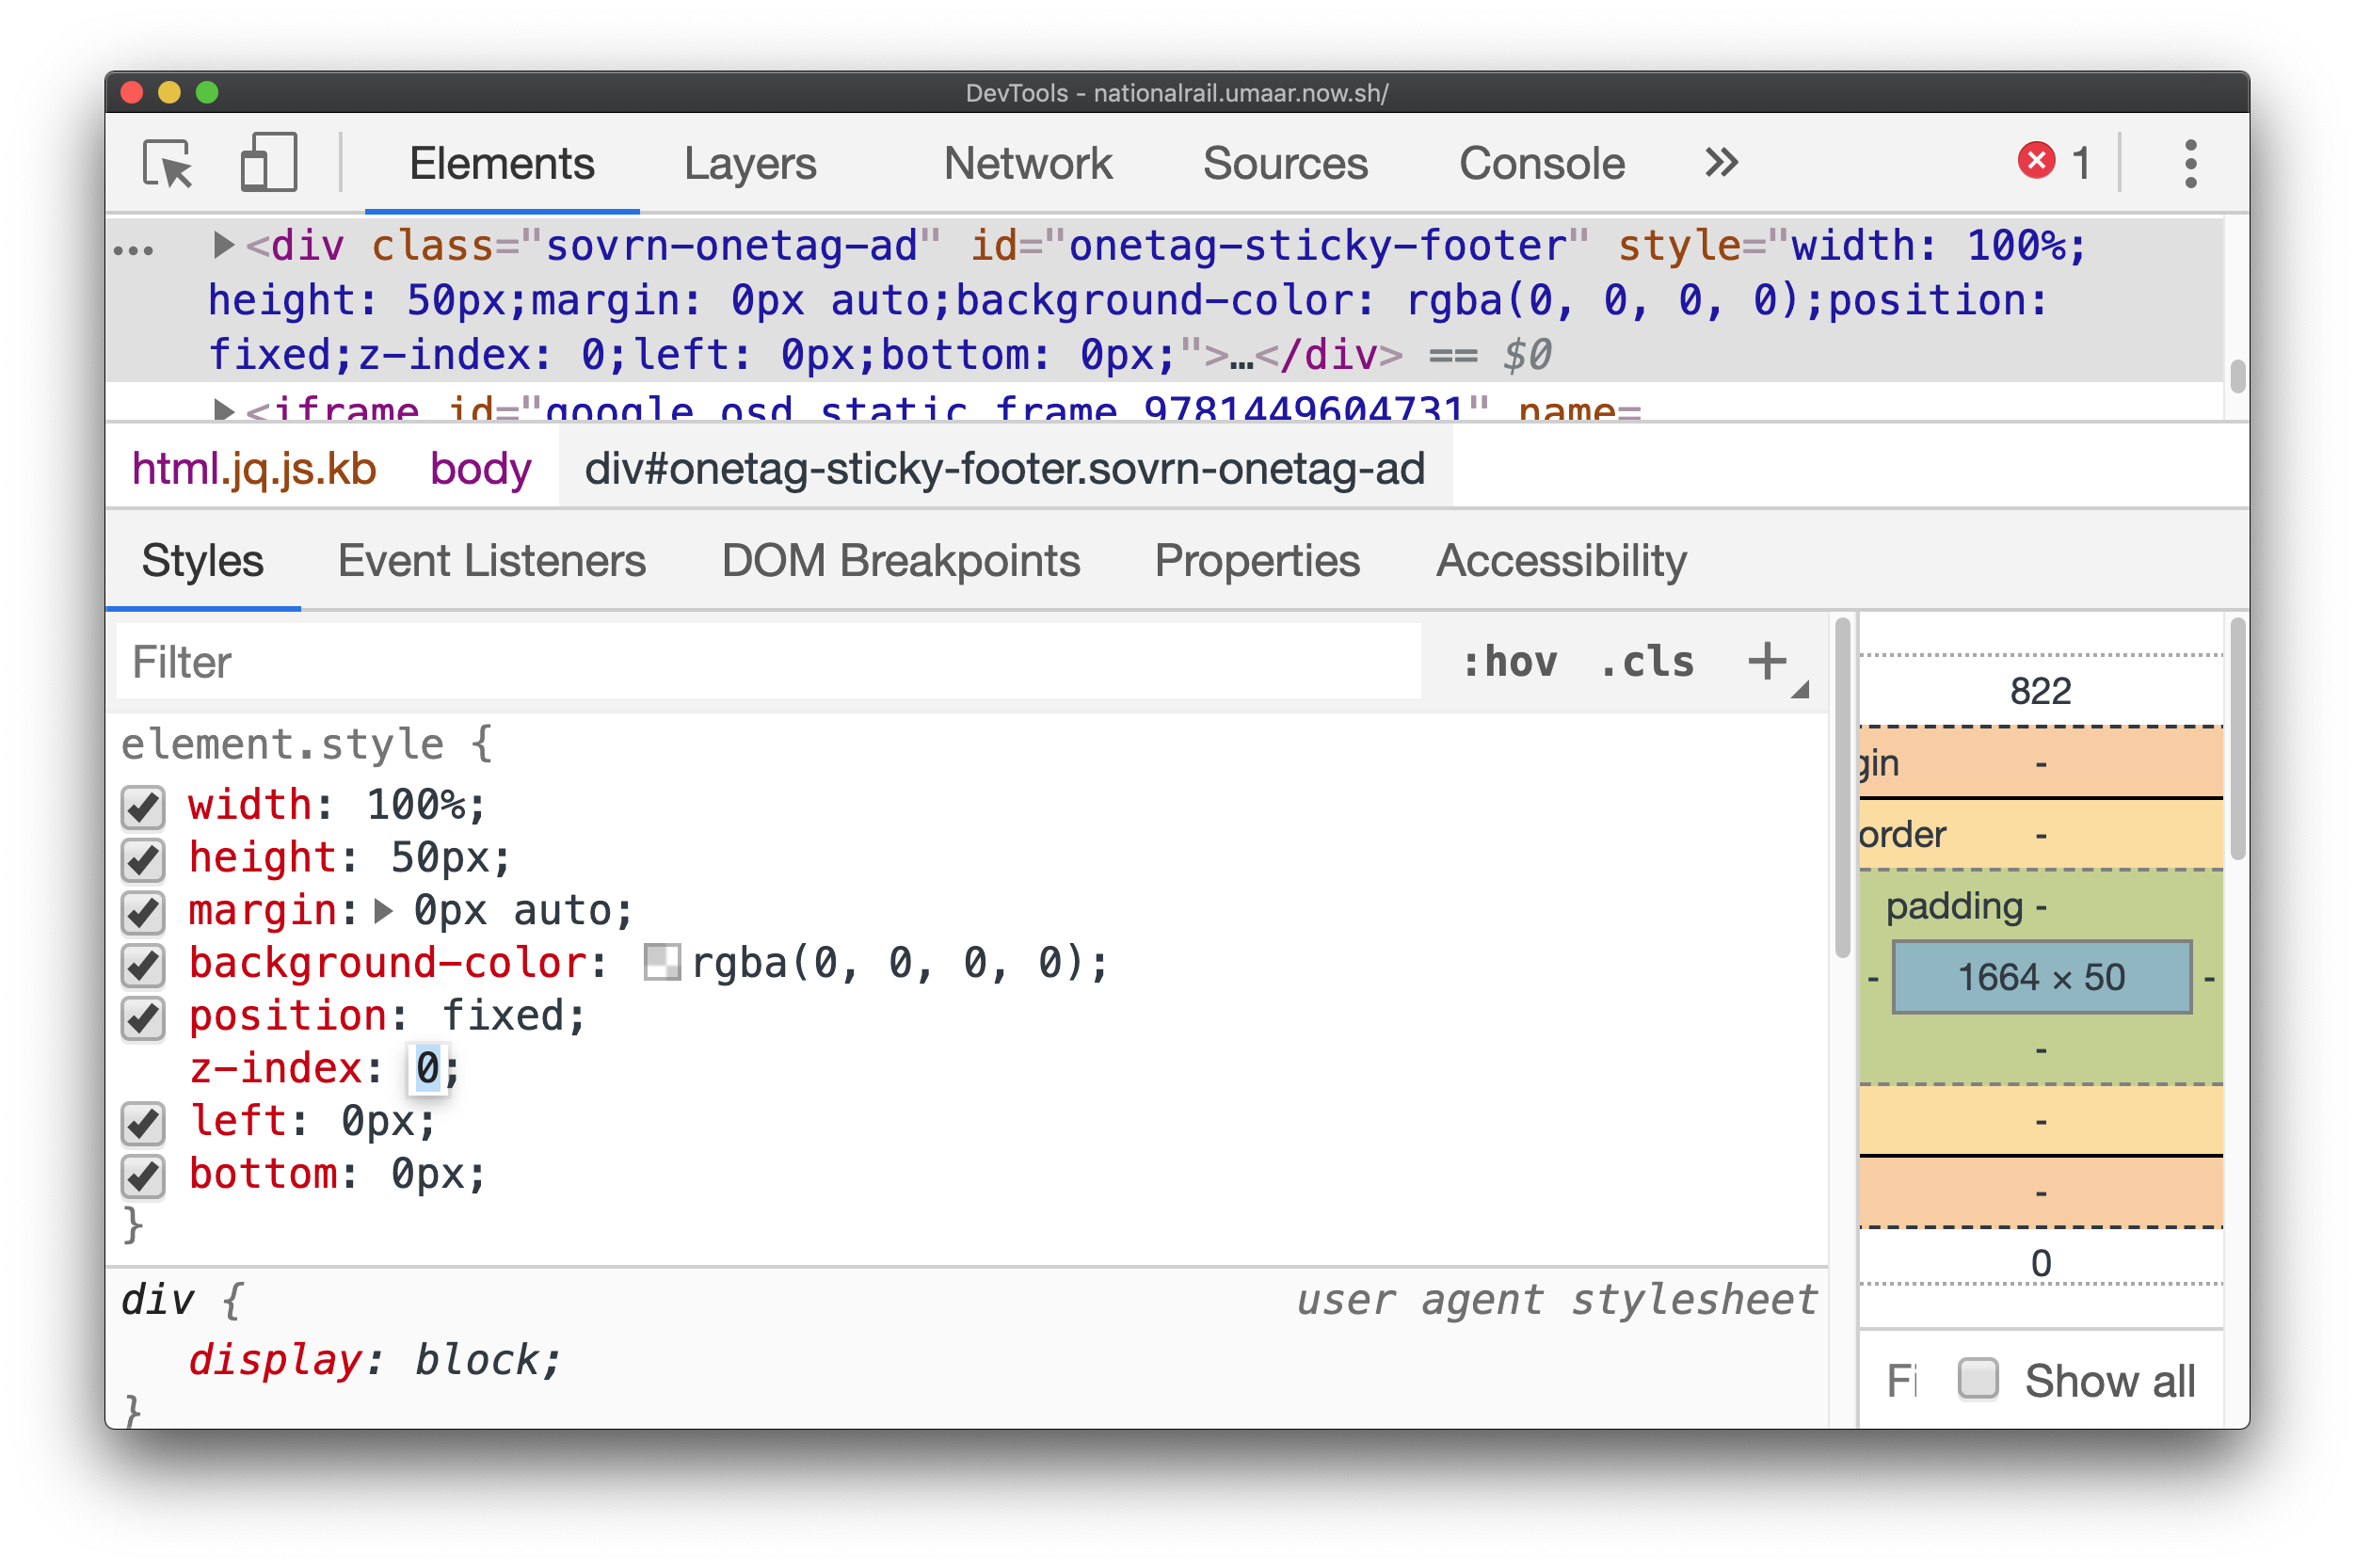
As an experiment, if we change the z-index of the found element to 0 , improvement can then be seen in the Layers Panel.
Conclusion
Note 1 : In reality, such a “fix” would need much more in-depth testing, as well as an understanding of the reason for the negative z-index in the first place.
Note 2 : If you’re following along at nationalrail.umaar.now.sh, you may occasionally see yet another large layer appear which consumes a decent chunk of memory. This didn’t happen for me consistently, but when it did occur, it seemed to be related to another z-index property on another element.
17. Improving the render performance of the Google Docs website
Lesson Details
- Lesson: 17
- Description: Investigating and improving the paint performance of a webpage
The goal of this lesson
To improve the performance of Google Docs.
What we’ll cover
- Introduction
- Viewing paint areas through DevTools
- Using the will-change CSS Property
- Layers Panel
- Conclusion
Introduction
The process of painting is part of the browser rendering process. You can learn more about this process in my video An Introduction to Browser Rendering.
Browsers will typically try to paint as small an area as possible, to speed up painting times. Part of performance investigations involve checking whether or not the paint area is as small as it should be.
Viewing paint areas through DevTools
DevTools can show paint rectangles, so you’re aware of how updates to the page need to be painted, but also how big those paint areas are. Use Cmd + Shift + P , search for paint , and enable paint rectangles.
If part of the page needs updating and the browser engine must paint those updates, you will notice green rectangles on the webpage which indicate paint areas.
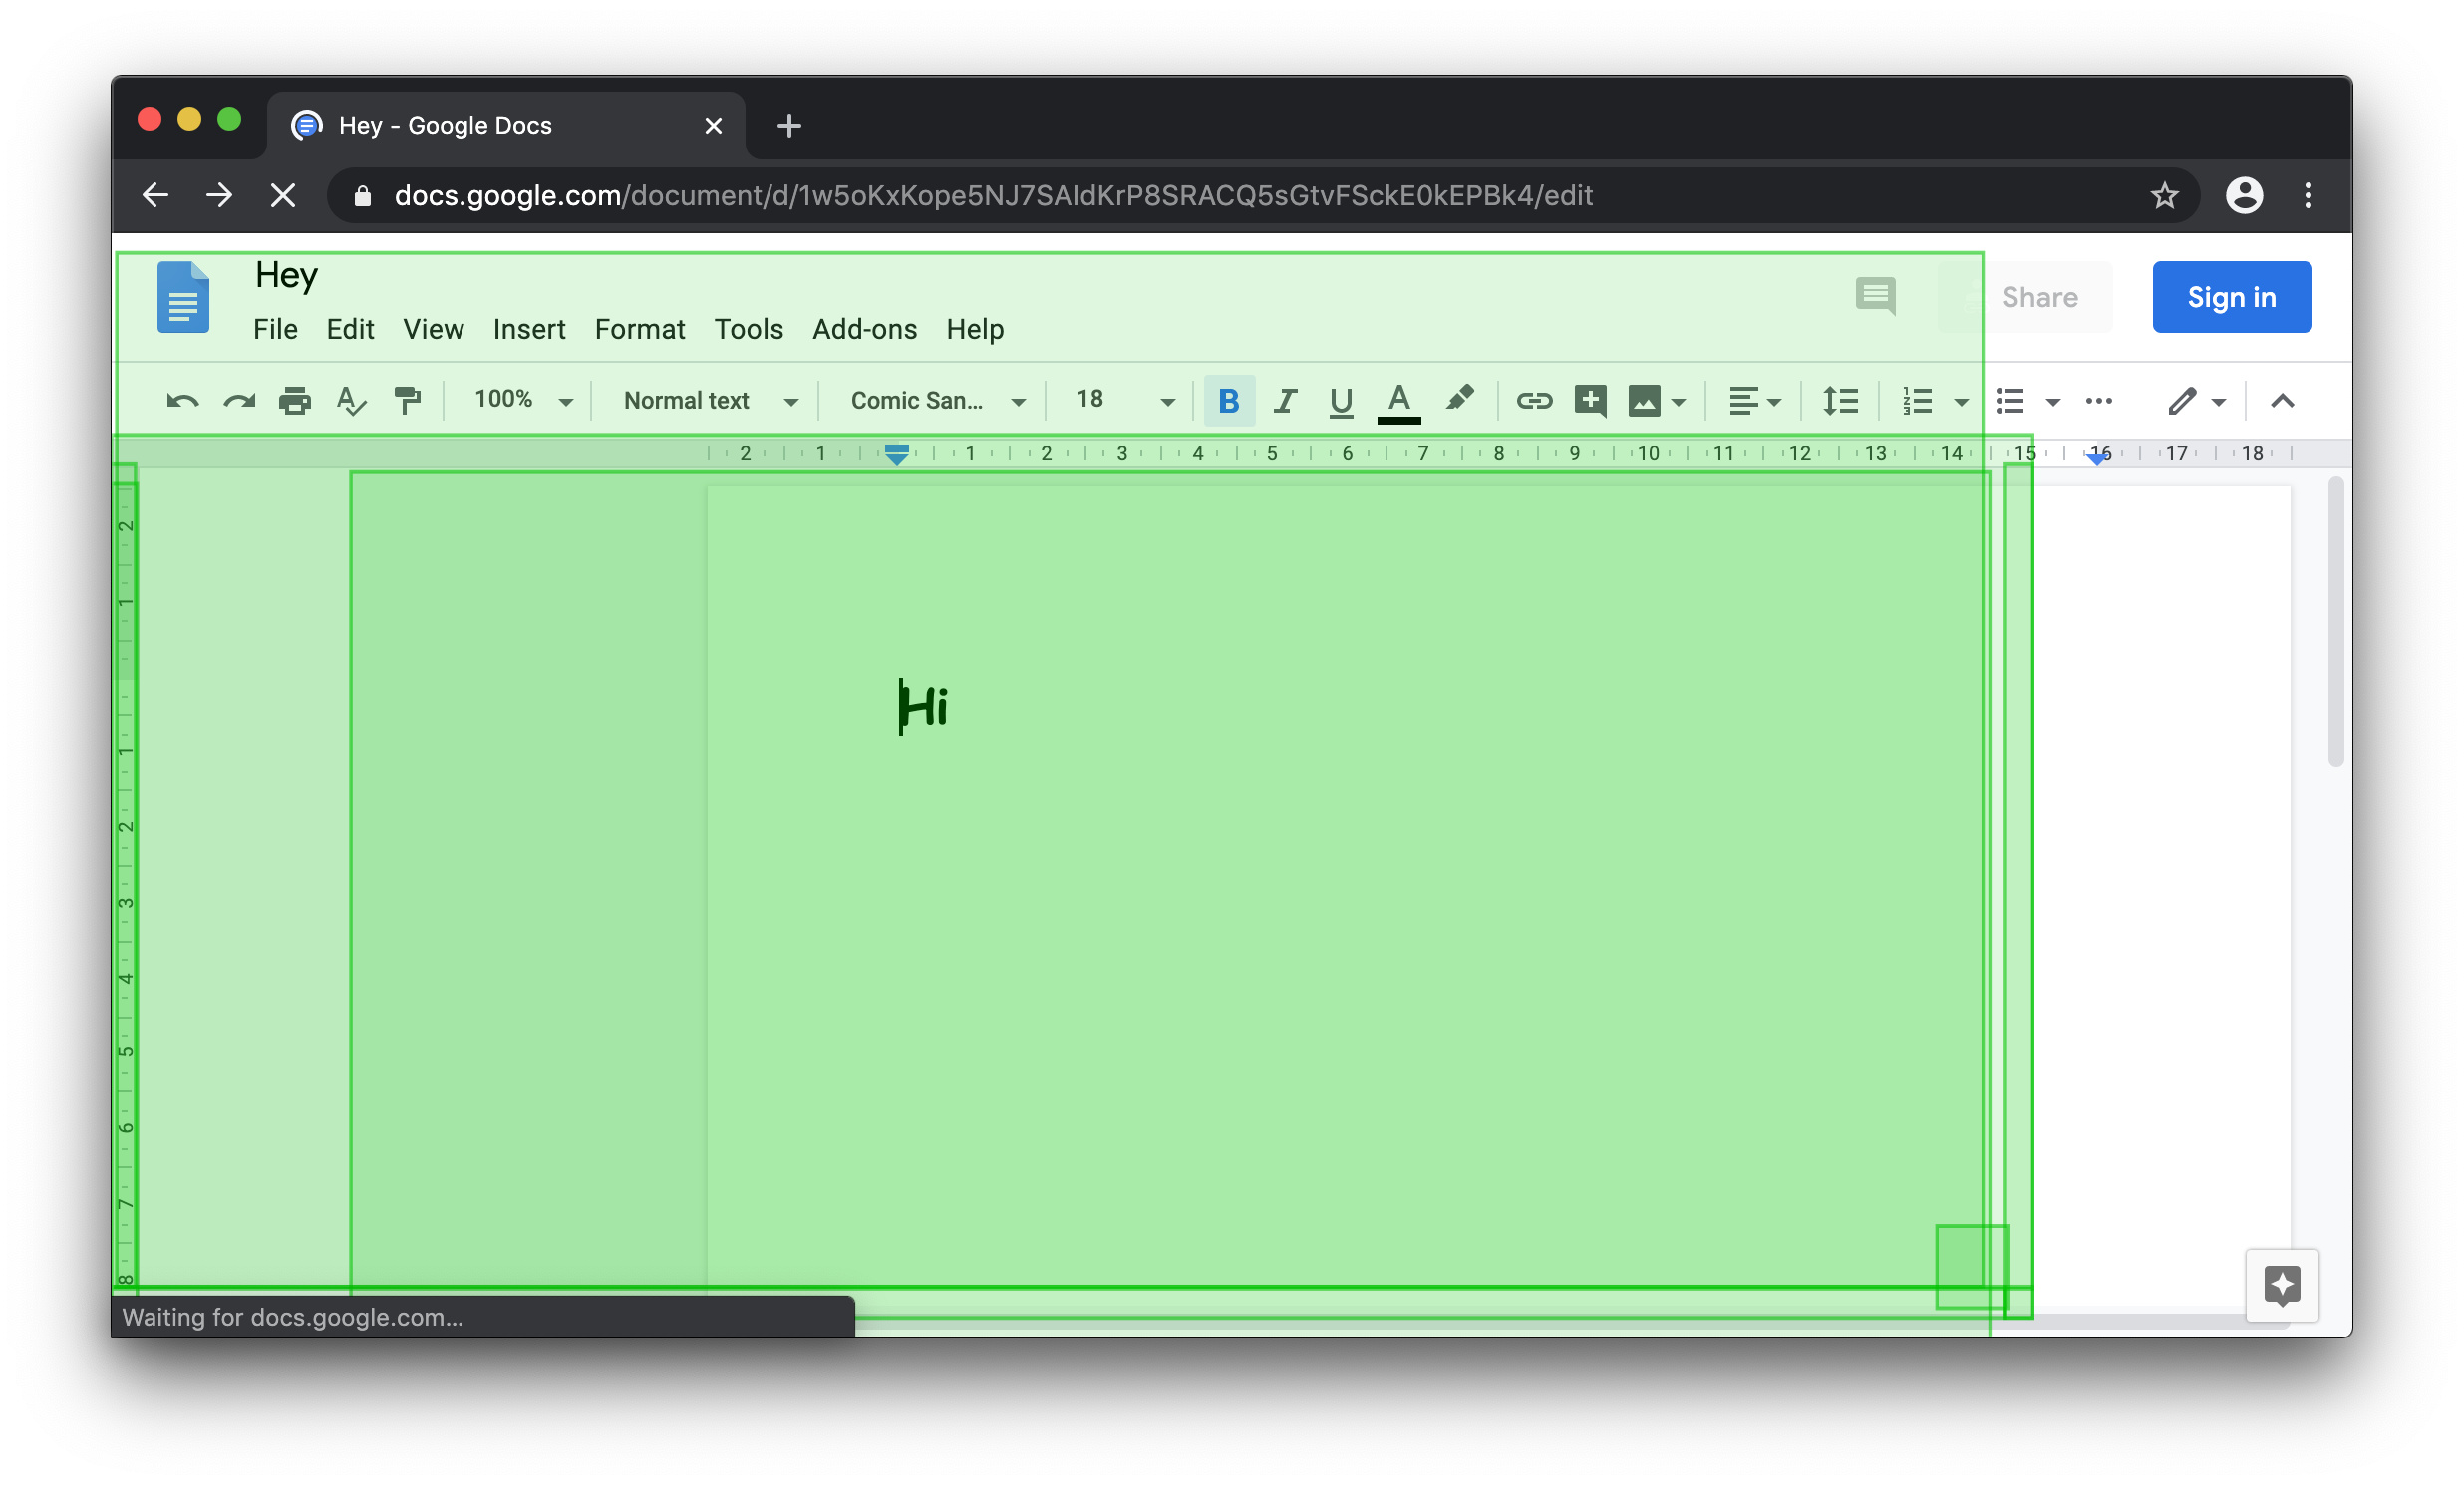
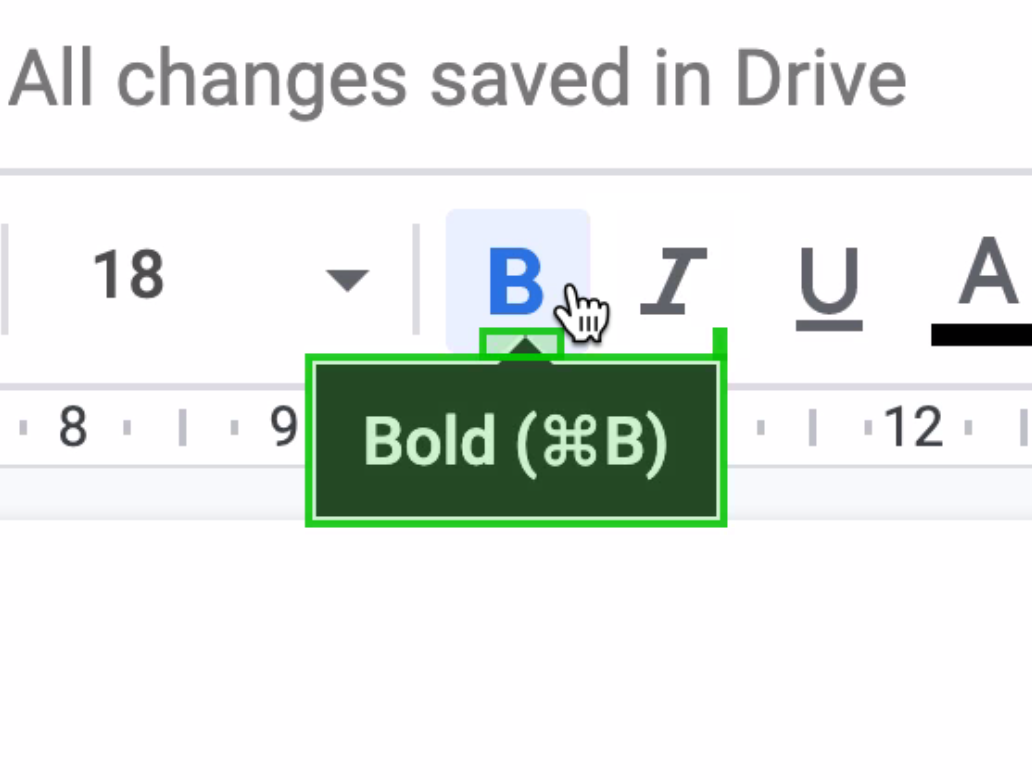
Google Docs Paint Area
At certain viewport dimensions, hovering over the bold/italic/underline icons presents a bigger paint area than expected. It seems to be the appearence of the tooltip which triggers this.
Using the will-change CSS Property
There’s no obvious reason why a tooltip should trigger a larger paint area than necessary, especially since a tooltip is often shown above page components, therefore not affecting the layout of anything else.
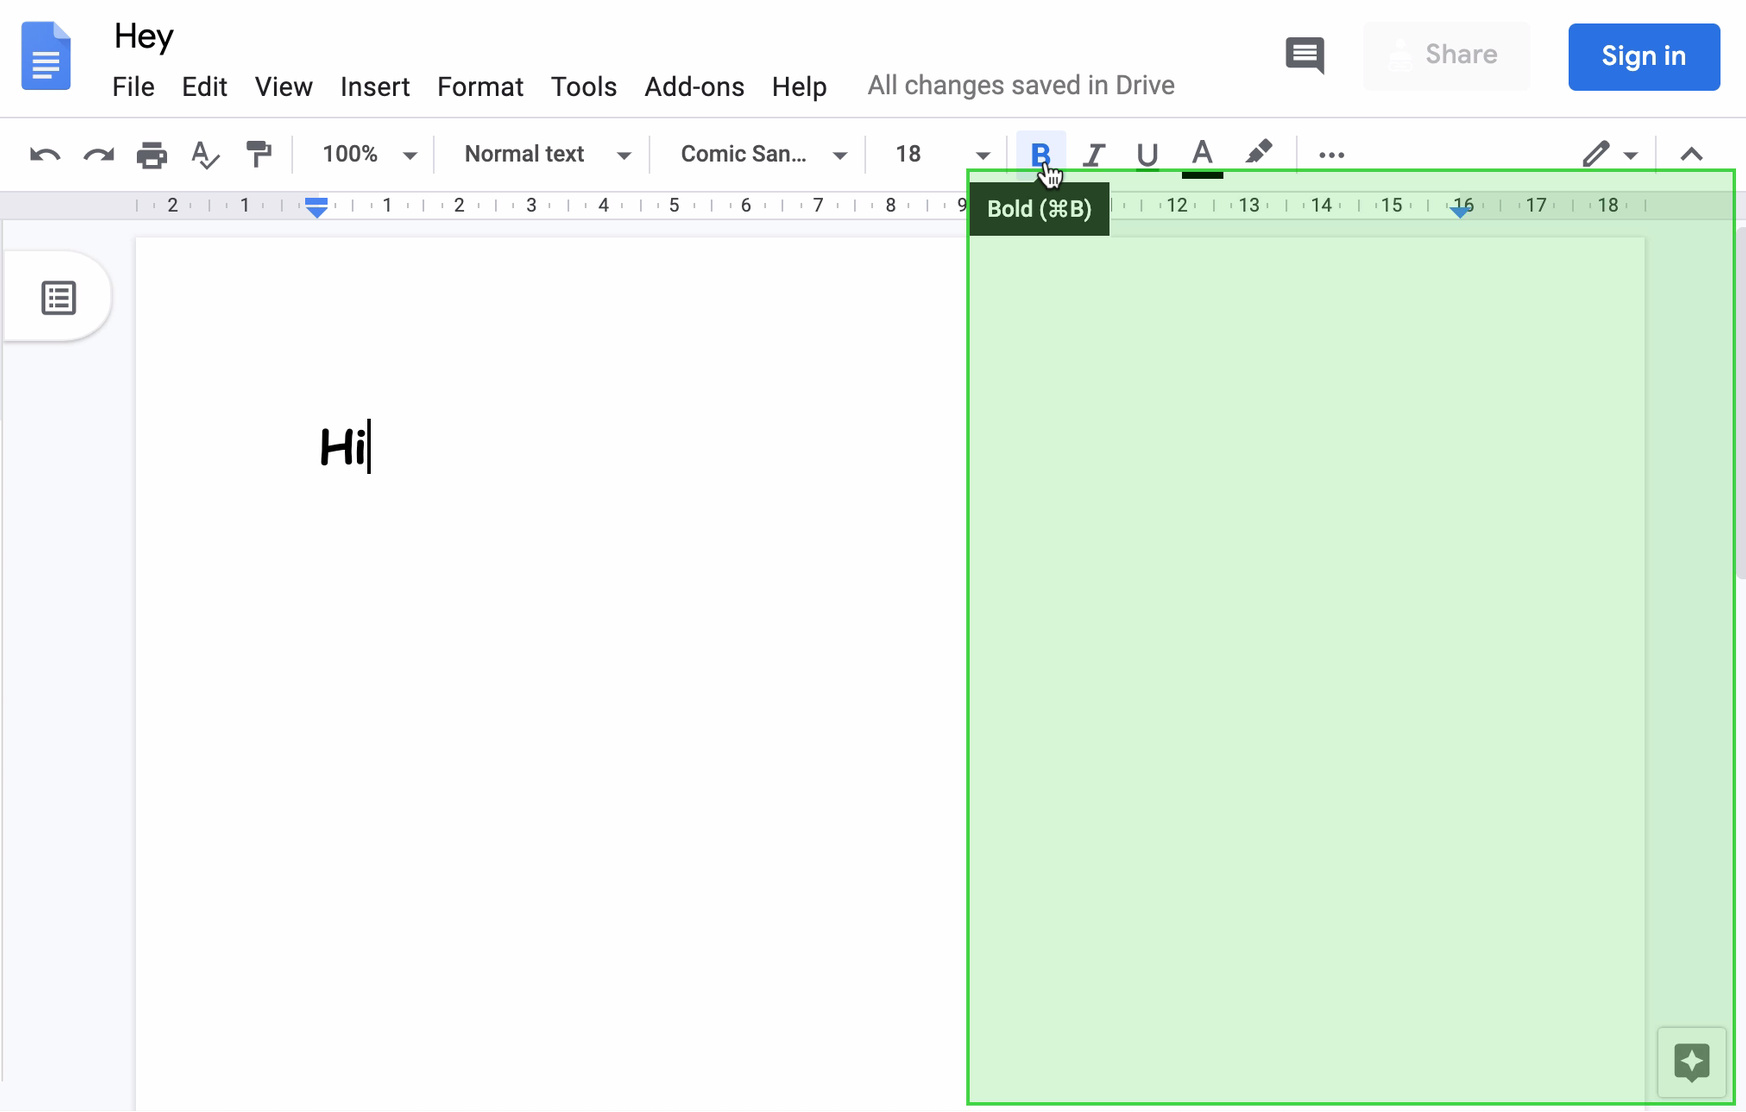
As a workaround, we can use the will-change CSS property which hints to the browser that this element may be suitable for layer promotion.
In this particular case, adding will-change results in a reduced paint area as the element is promoted to its own layer.
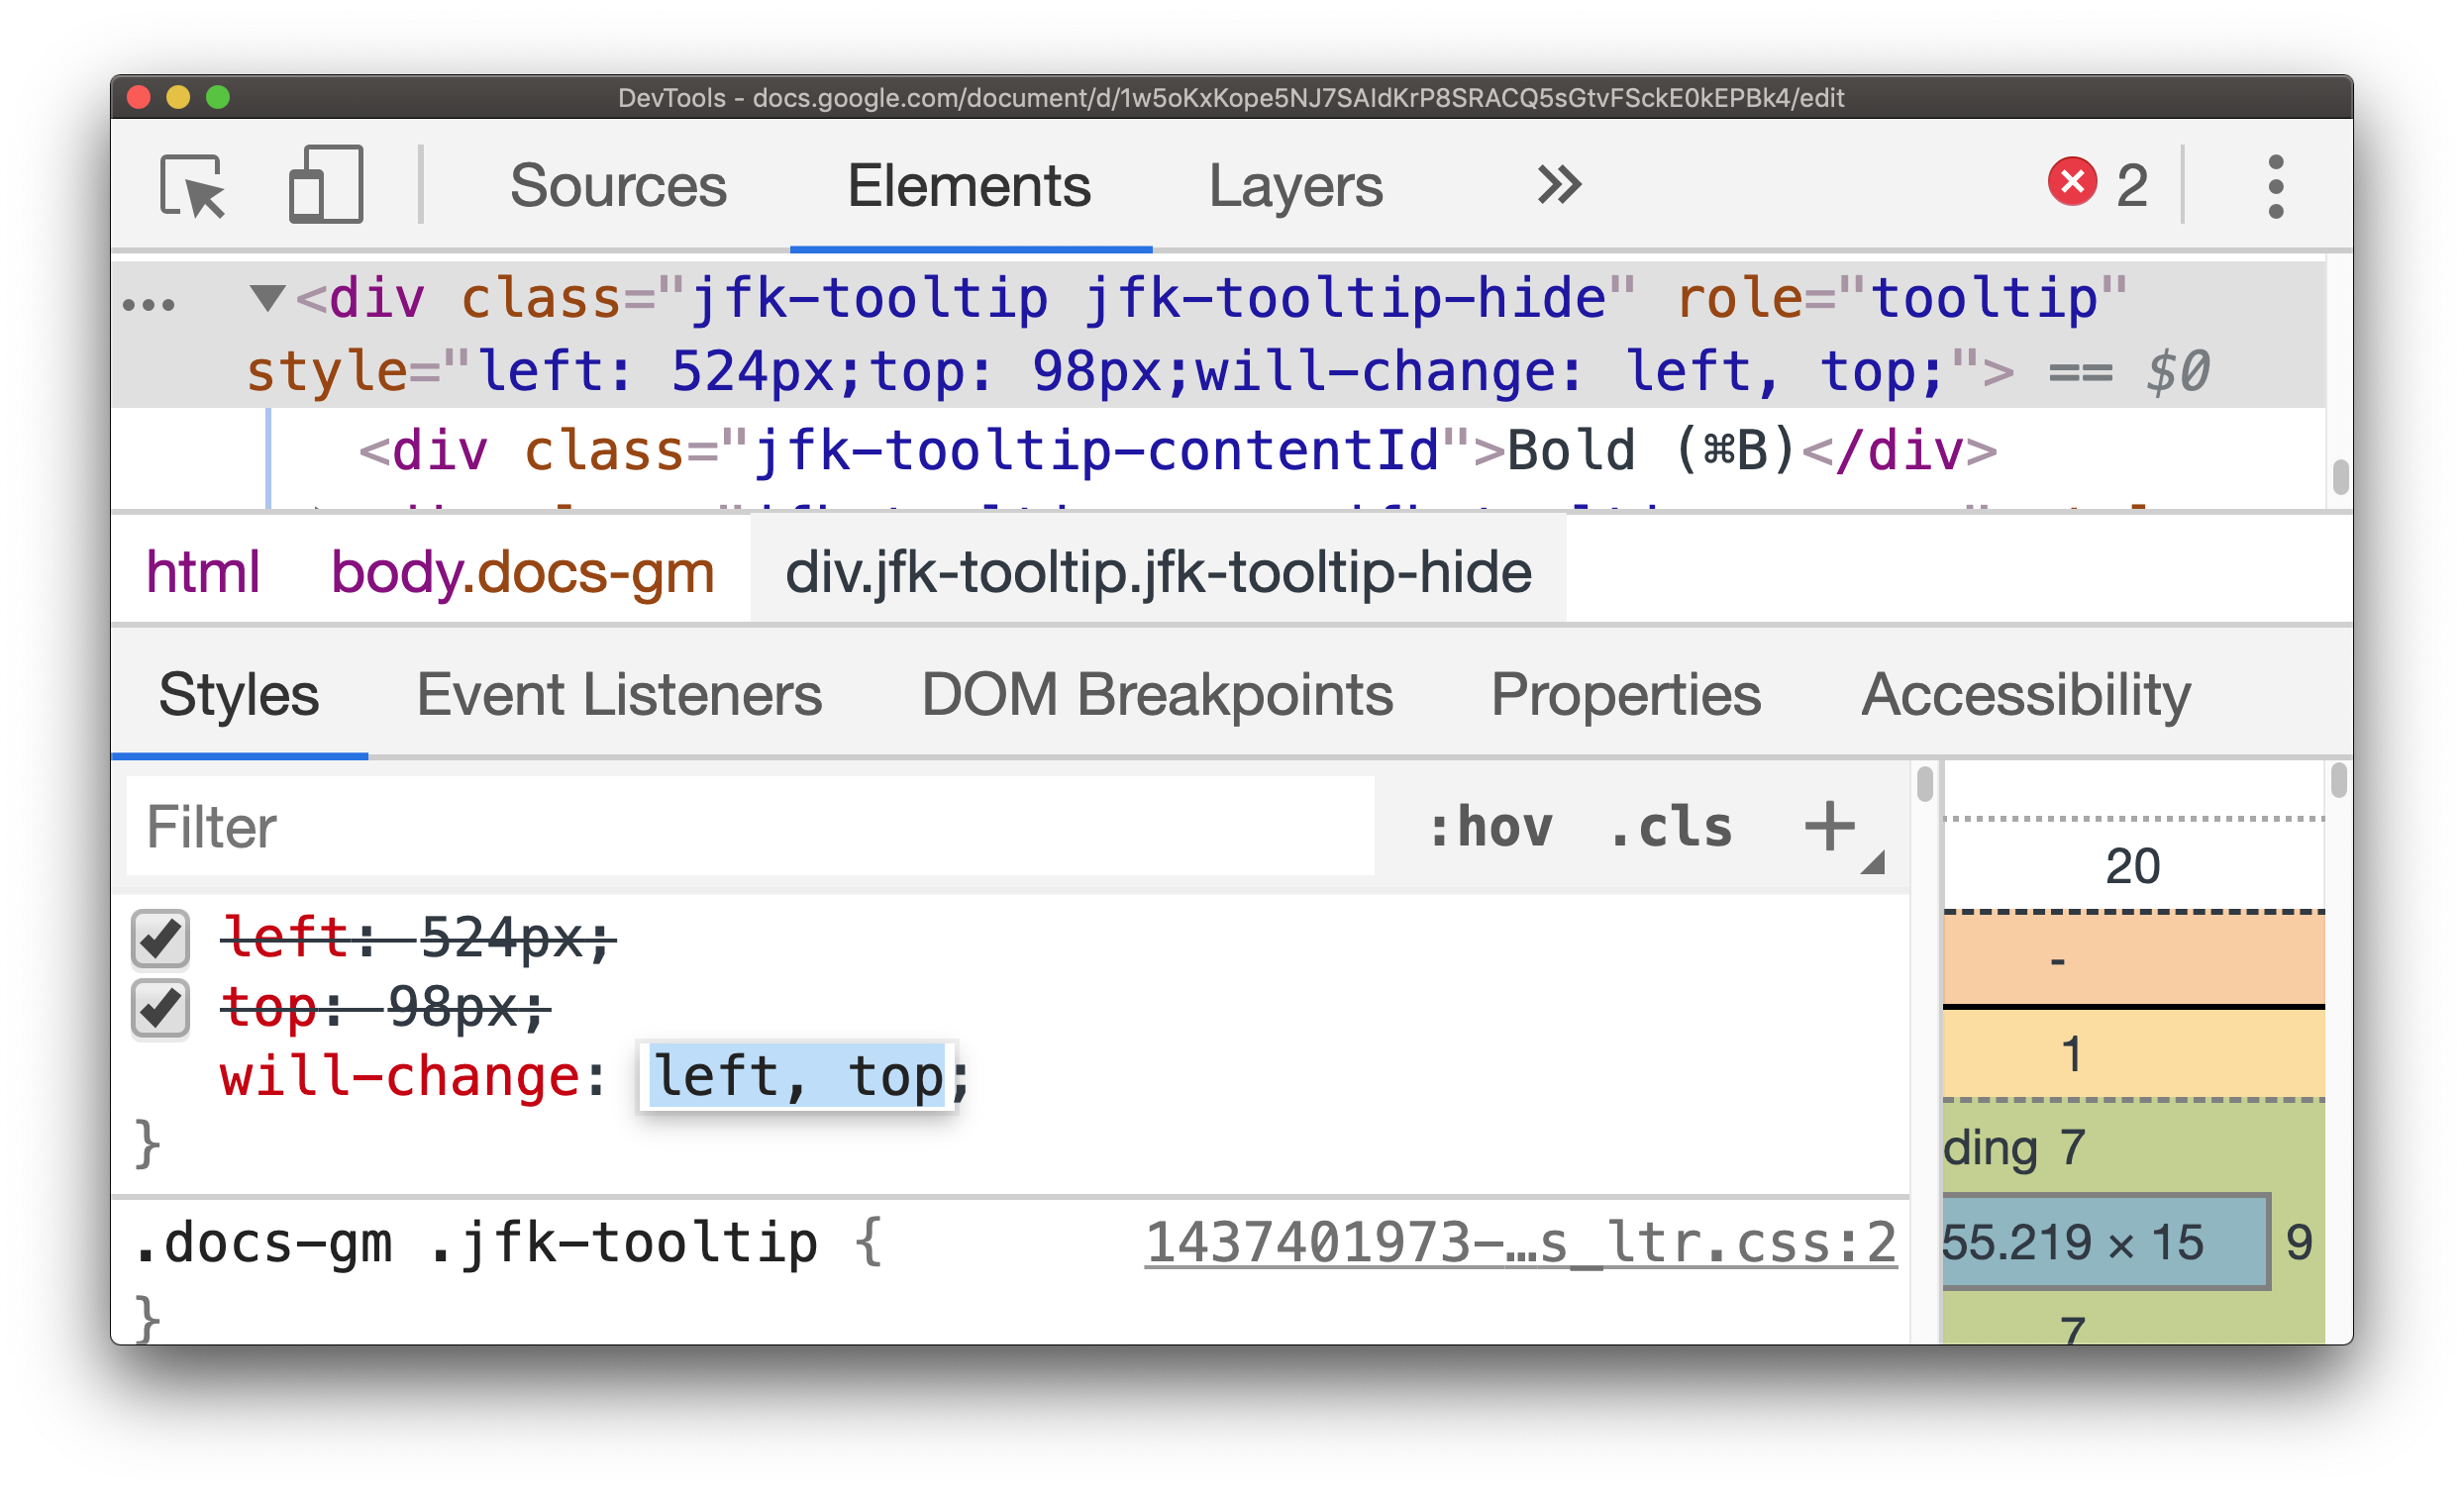
Layers Panel
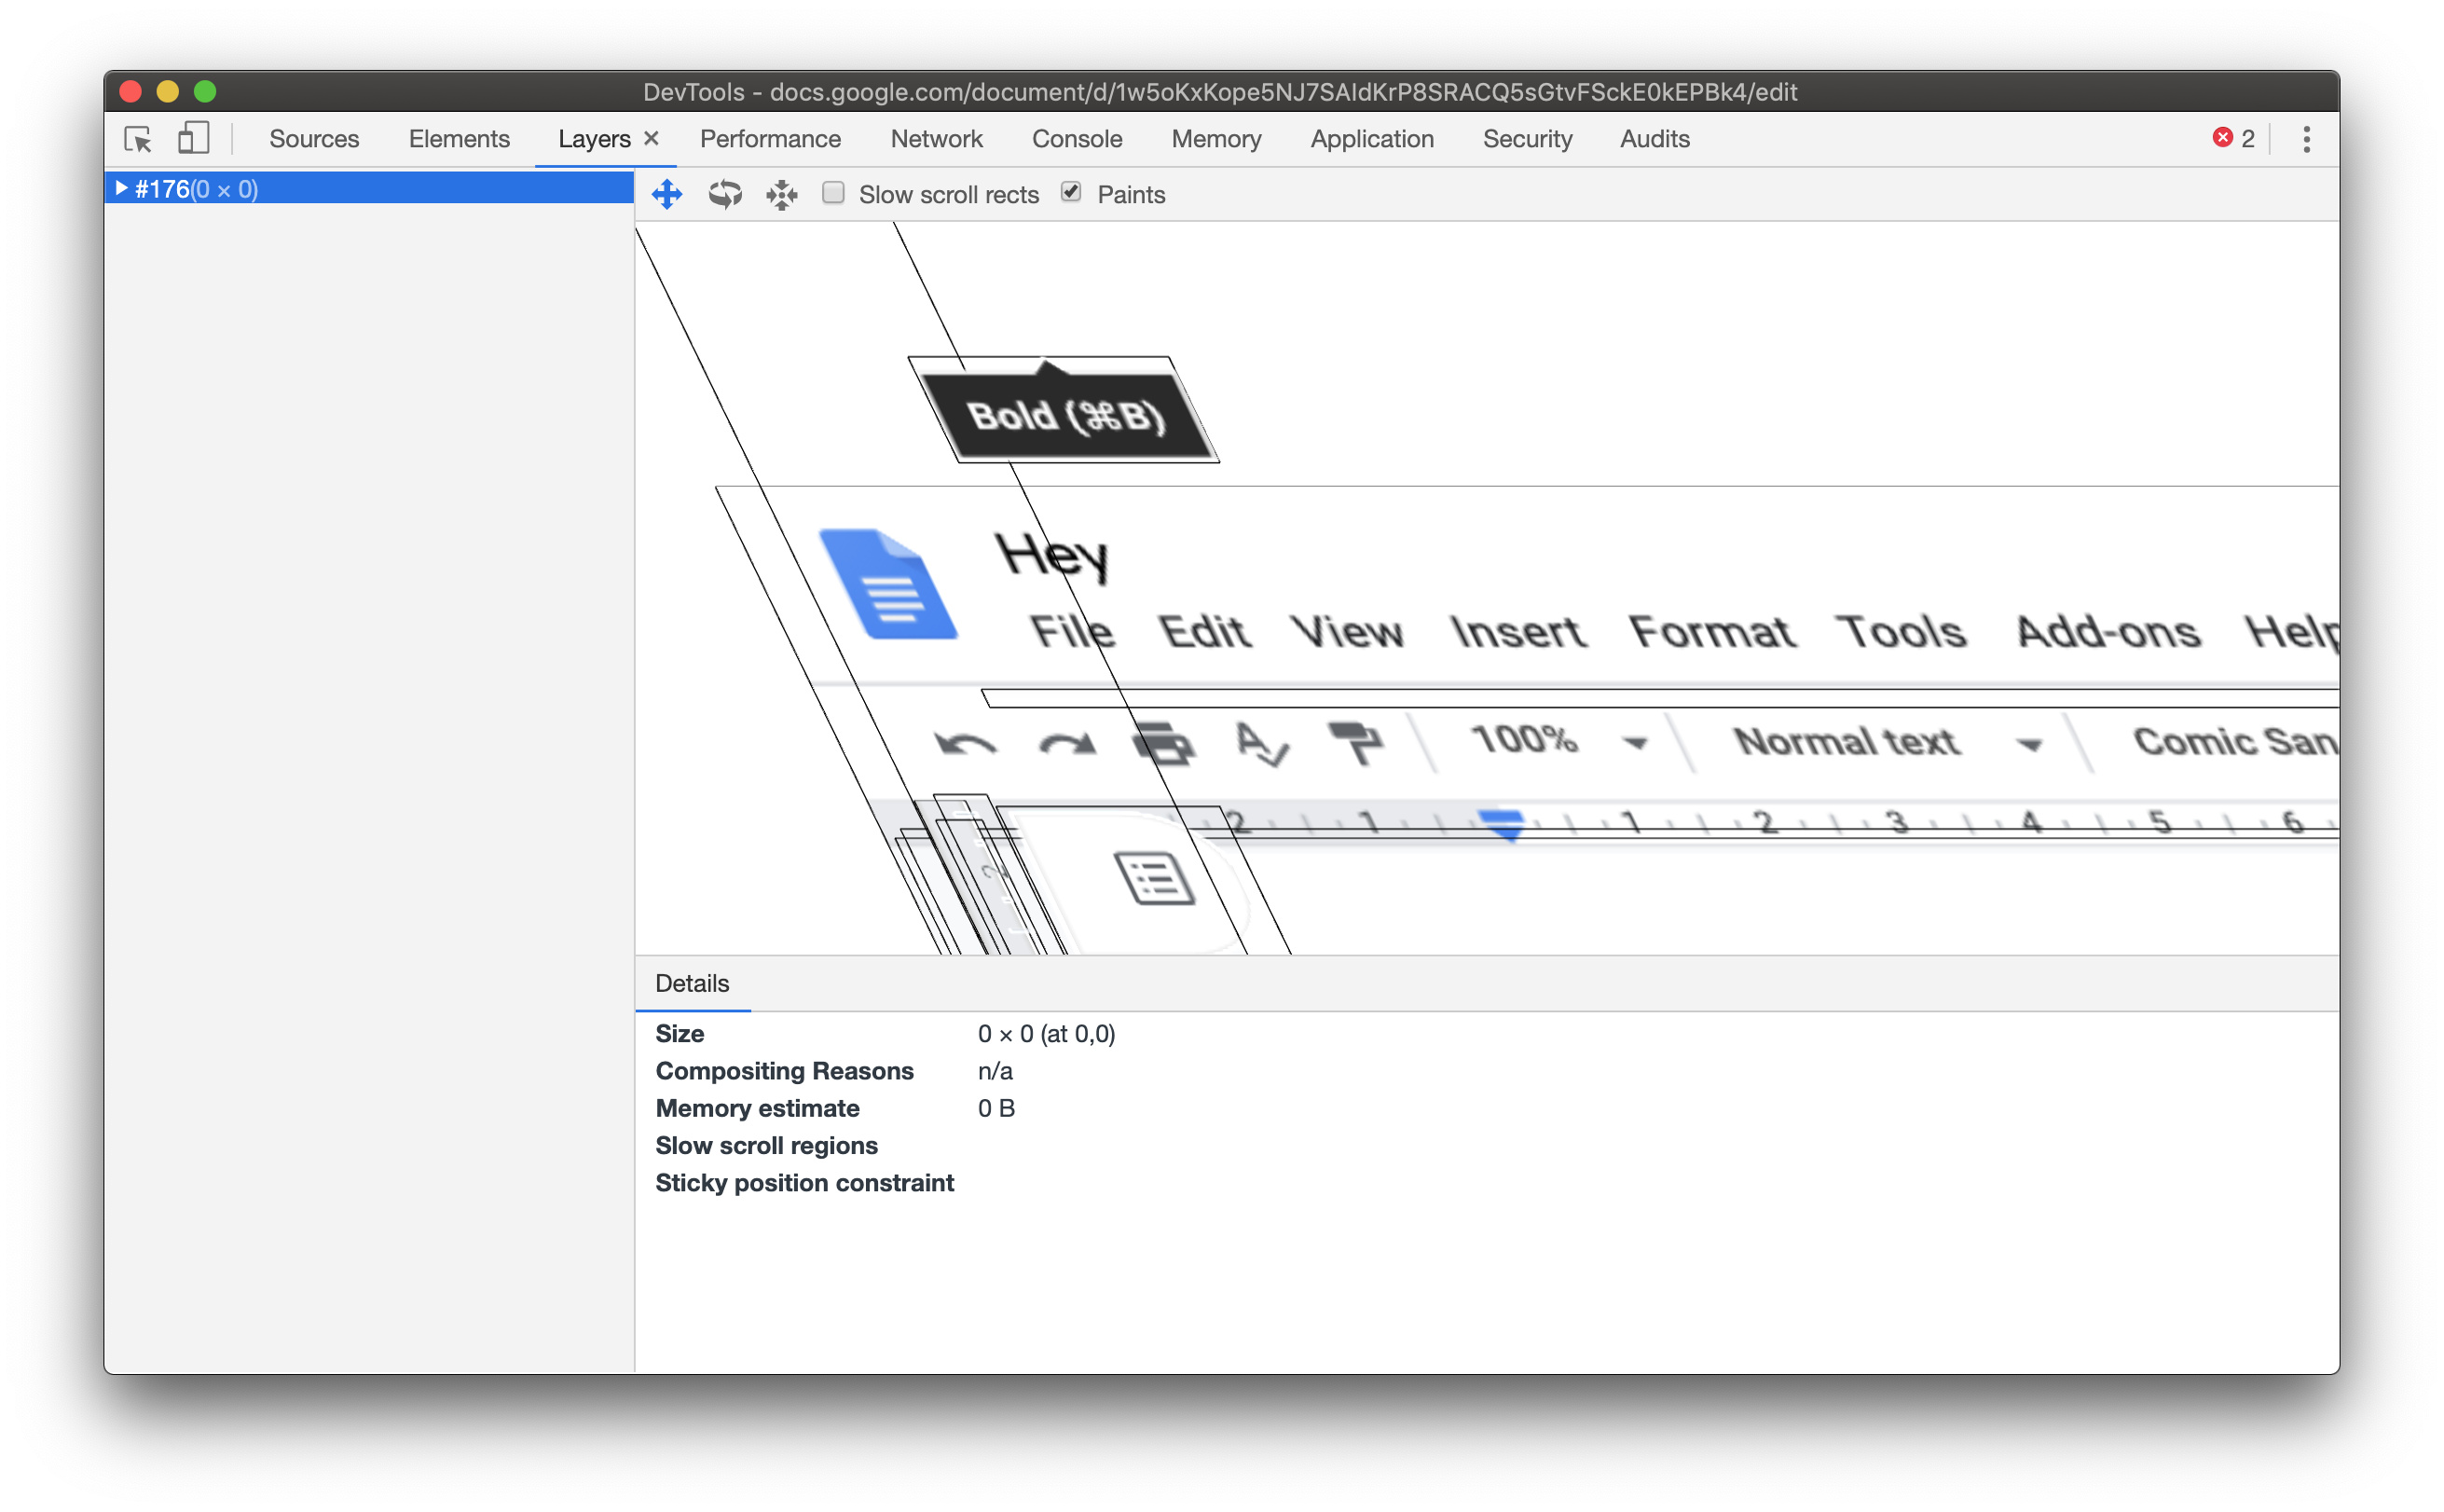
The Layers Panel in DevTools shows how the tooltip is on its own layer.
Conclusion
The less painting a browser has to do, the more performant a webpage will be. Viewing paint rectangles can highlight areas of a webpage which may need investigating. If the entire page flashes green from simply hovering over a hyperlink, it’s then worth investigating what CSS (and maybe JavaScript) could be contributing to this.
The will-change trick acted as a potential fix here, but should be used sparingly since excessive layer promotion can be a performance bottleneck, sometimes however, hinting to the browser that an element is “independent” and does not affect other elements, can help in terms of reducing paint areas.