Debugging JavaScript
Debugging is one of those skills that’s core to the activity of a programmer.
Sometimes we do our best work, yet the program is not working correctly, for example, it’s crashing, it’s just slow or it’s printing wrong information.
What do you do when a program you wrote is not behaving like you expect?
You start debugging it.
Figuring out where the error could be
The first step is always to look at what is happening, and trying to determine where is the problem coming from. Is it a problem in the environment? Is it a problem in the input you gave to the program? Is it a one-time crash due to too much memory usage? Or is it happening every time you run it?
Those are all key information to start going in the right direction when figuring out a problem.
Once you have some sort of idea where the error is coming from, you can start checking that specific part of code.
Read the code
The simplest way to debug, at least in terms of tooling, is by reading the code you wrote. Aloud. There is some magical thing in hearing from our own voice that does not happen when you read in silence.
Often times I found problems in this way.
Using the console
If reading the code reveals nothing to you, the next logical step is to start adding a few lines into your code that can shed some light.
In JavaScript frontend code what you’ll often do is to use alert() and console.log (and its cool friends).
Consider this line:
const a = calculateA()
const b = calculateB()
const result = a + b
Somehow the result is not correctly calculated, so you can start by adding alert(a) and alert(b) before calculating the result, and the browser will open two alert panels when it executes the code.
const a = calculateA()
const b = calculateB()
alert(a)
alert(b)
const result = a + b
This works fine if what you are passing to alert() is a string or a number. As soon as you have an array or an object things start to be too complicated for alert() , and you can use the Console API. Starting with console.log() :
const a = calculateA()
const b = calculateB()
console.log(a)
console.log(b)
const result = a + b
The value is printed in the JavaScript console of the browser developer tools. For convenience I’m explaining debugging in the Chrome DevTools here, but the general concepts apply to all browsers, with some differences in terms of features supported.
The Chrome Dev Tools
The result of the console.log() calls is printed to the JavaScript console. This is a tool that’s more or less common to every browser:
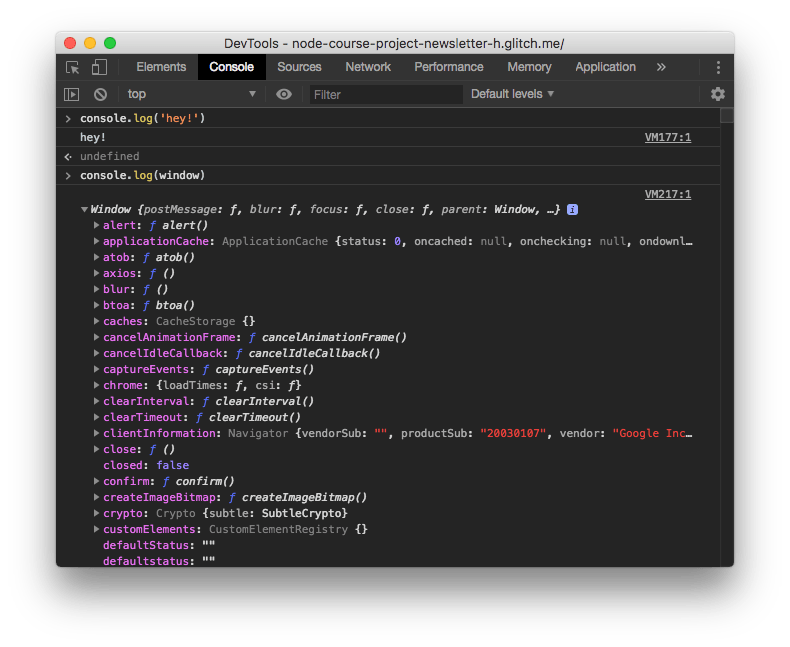
The tool is very powerful and lets you print complex objects or arrays and you can inspect every property of them.
In the Console API post you can see all the options and details of working with it, so I’m not explaining all the details here.
The debugger
The debugger is the most powerful tool in the browser developer tools, and it’s found in the Sources panel:
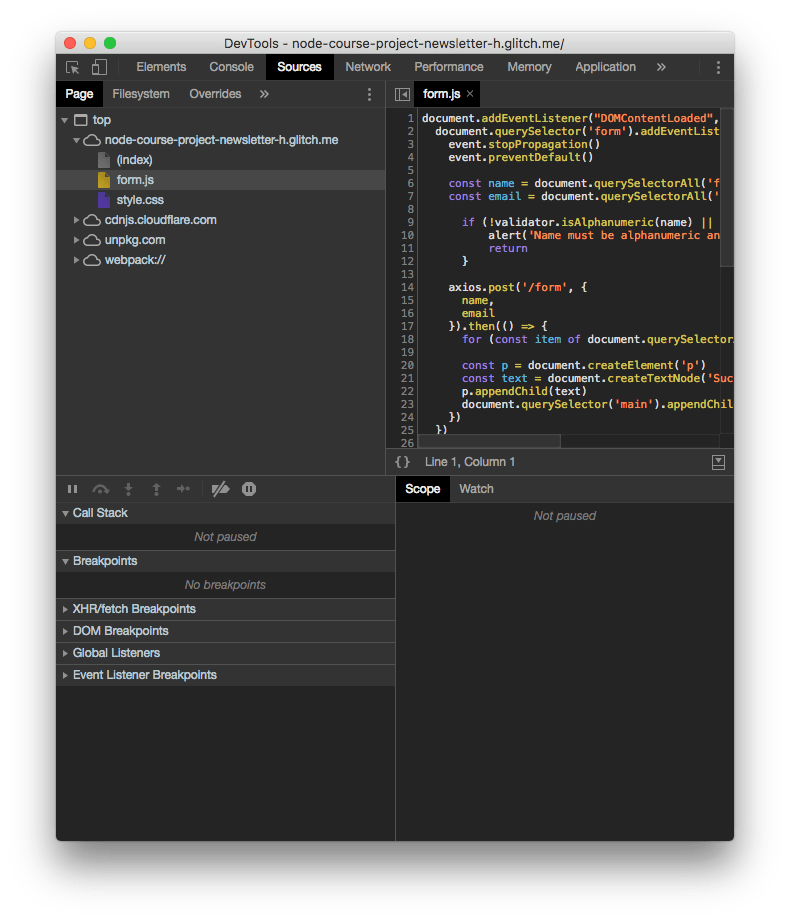
The top part of the screen shows the files navigator.
You can select any file and inspect it on the right. This is very important to set breakpoints, as we’ll see later.
The bottom part is the actual debugger.
Breakpoints
When the browser loads a page, the JavaScript code is executed until a breakpoint is met.
At this point the execution is halted and you can inspect all about your running program.
You can check the variables values, and resume the execution of the program one line at a time.
But first, what is a breakpoint? In its simple form, a breakpoint is a breakpoint instruction put in your code. When the browser meets it, it stops.
This is a good option while developing. Another option is to open the file in the Sources panel and click the number on the line you want to add a breakpoint:
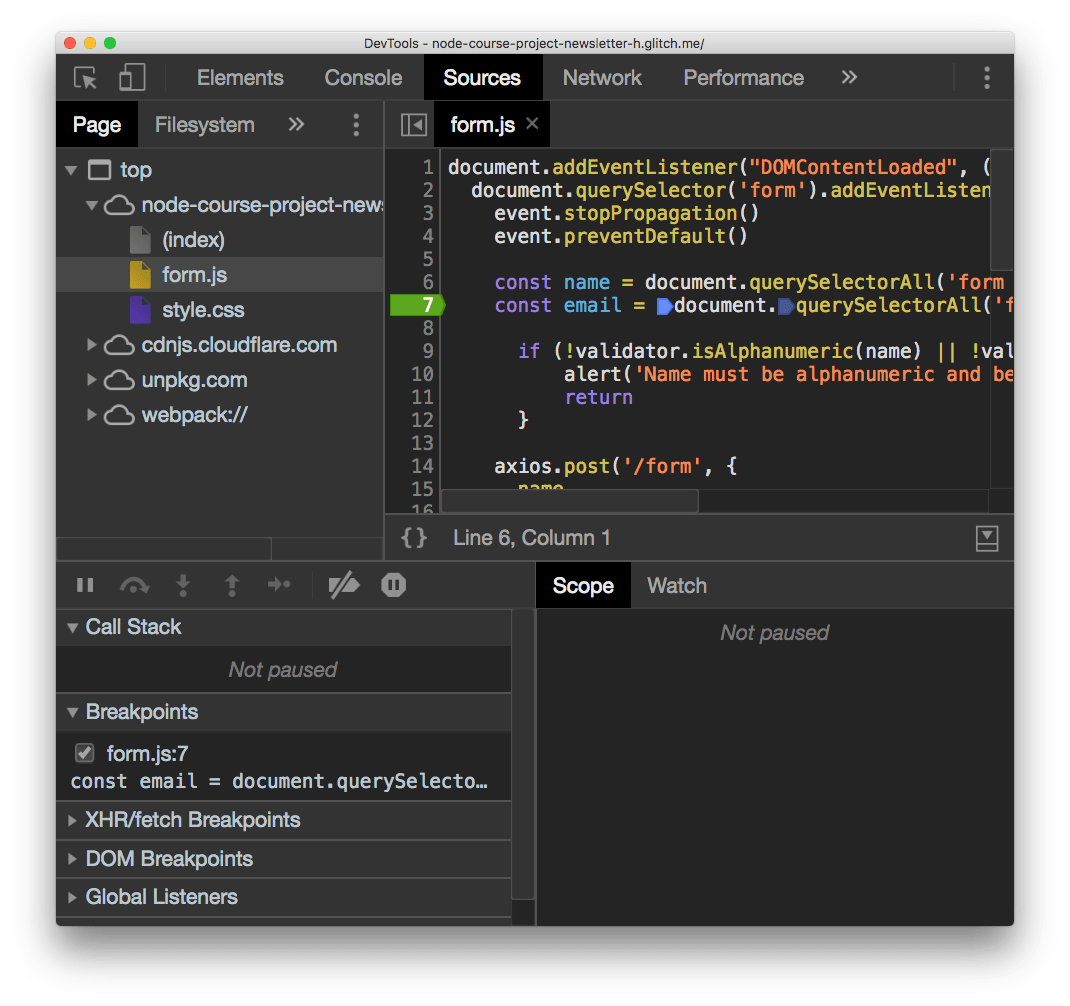
Clicking again the breakpoint will remove it.
After you add a breakpoint you can reload the page and the code will stop at that execution point when it finds the breakpoint.
As you add the breakpoint you can see in the Breakpoints panel that form.js on line 7 has the breakpoint. You can see all your breakpoints there, and disable them temporarily.
There are other types of breakpoints as well:
- XHR/fetch breakpoints : triggered when any network request is sent
- DOM breakpoints : triggered when a DOM element changes
- Event listener breakpoints : triggered when some event happens, like a mouse click

Scope
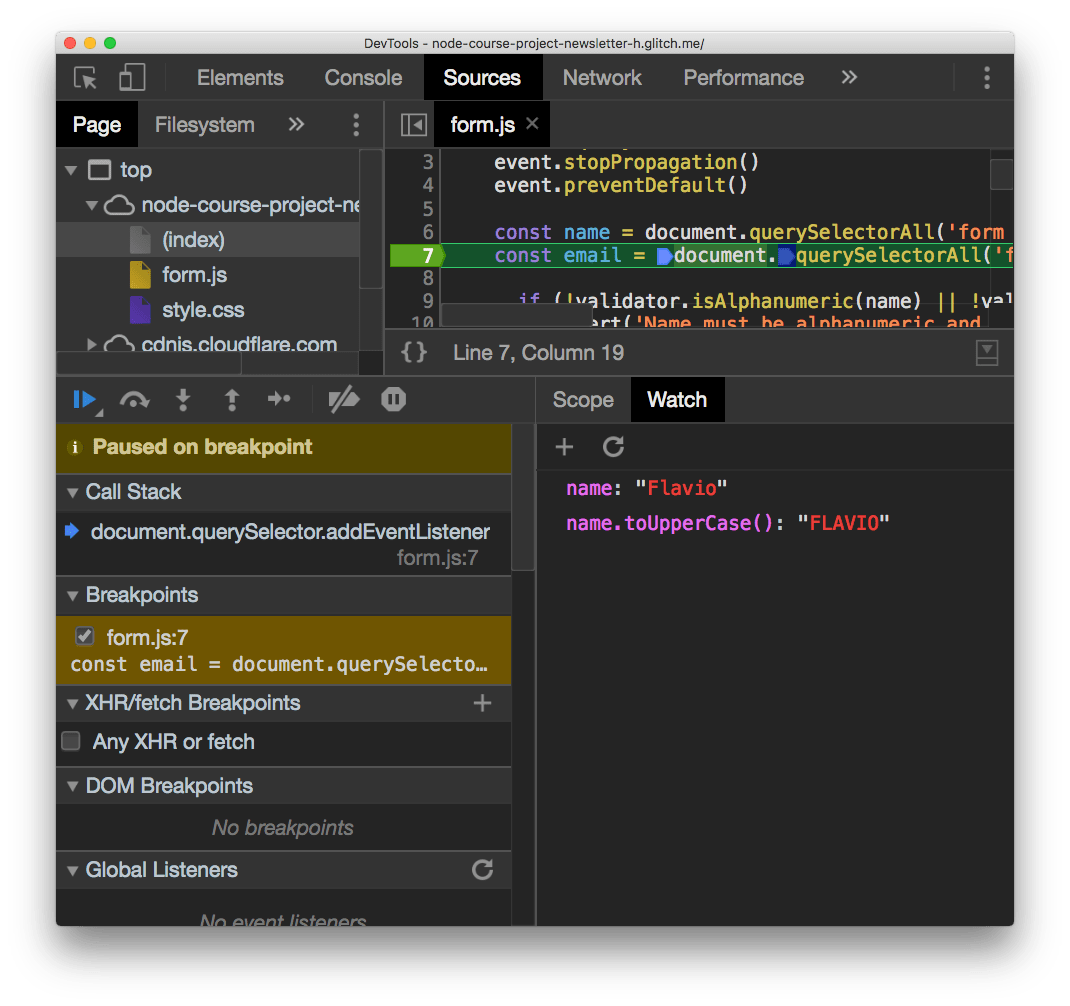
In this example I set a breakpoint inside an event listener, so I had to submit a form to trigger the it:

Now all the variables that are in the scope are printed, with their respective values. You can edit those variables by double clicking them.
Watch variables and expressions
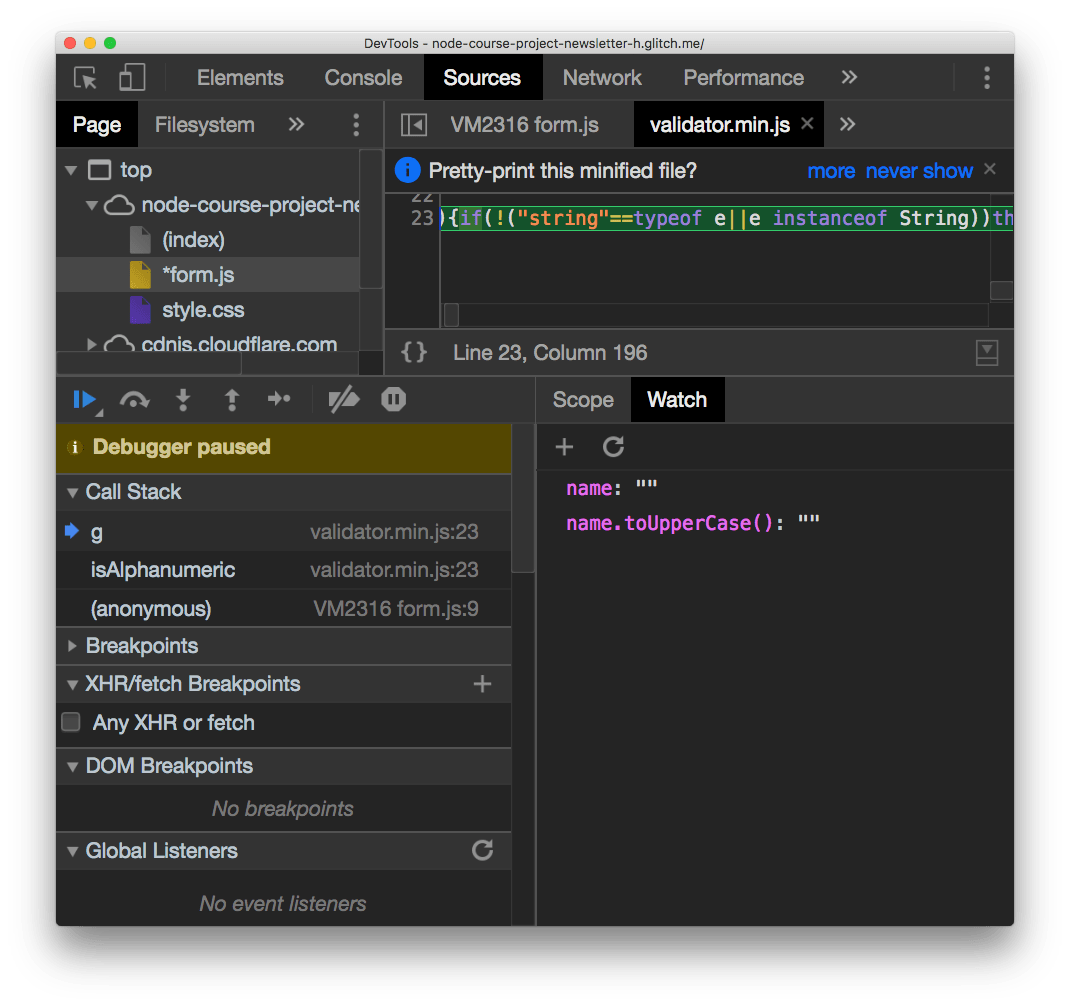
Right to the Scope panel there’s the Watch panel.
It has a + button which you can use to add any expression. For example, adding name will print the name variable value, in the example Flavio . You can add name.toUpperCase() and it will print FLAVIO :
Resume the execution
Now the scripts are all halted since the breakpoint stopped the execution.
There is a set of buttons above the “Paused on breakpoint” banner that let you alter this state.
The first is in blue. Clicking it resumes the normal script execution.
The second button is step over , and it resumes execution until the next line, and stops again.
The next button perform a step into operation: goes into the function being executed, letting you go into the details of it.
Step out is the opposite: goes back to the outer function calling this one.
Those are the main ways to control the flow during debugging.
Edit scripts
From this devtools screen you can edit any script, also while the script is halted in its execution. Just edit the file and press cmd-S on Mac or ctrl-S on Windows/Linux.
Of course the changes are not persisted to disk unless you are working locally and set up workspaces in the devtools, a more advanced topic.
Inspect the call stack
The call stack is great to see how many functions levels you are deep into the JavaScript code. It lets you move up in the stack too by clicking each function name:
Blackbox scripts
Often times you work with libraries where you don’t want to “step into”, you trust them and you don’t want to see their code in the call stack, for example. Like in the above case for validator.min.js , which I use for email validation.
I trust it does a good job, so I can right-click it in the call stack and press Blackbox script . From then on, it’s impossible to step into this script code, and you happily work on just your own application code.
Use the browser devtools to debug Node.js
Since Node.js is built on the same engine of Chrome, v8, you can link the 2 and use the Chrome DevTools to inspect the execution of Node.js applications.
Open your terminal and run
node --inspect
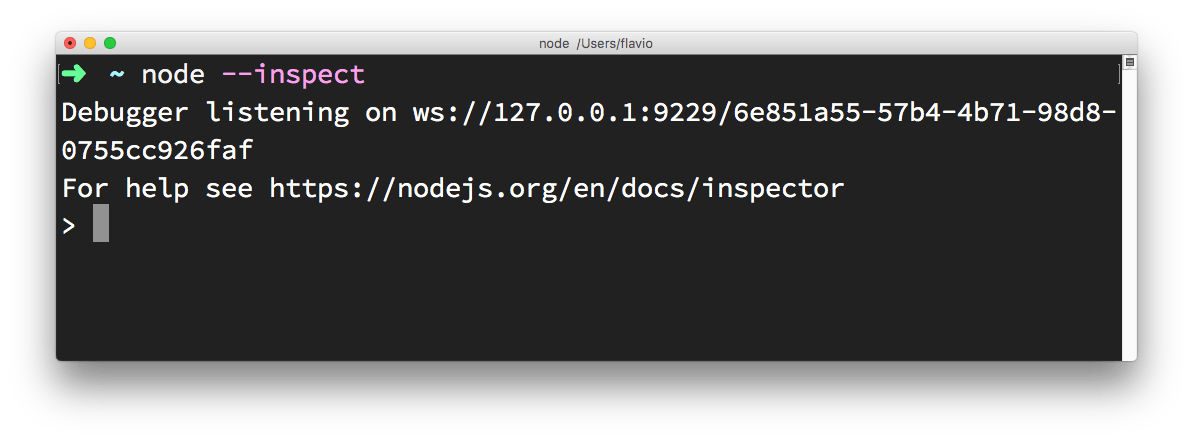
Then in Chrome type this URL: about://inspect .
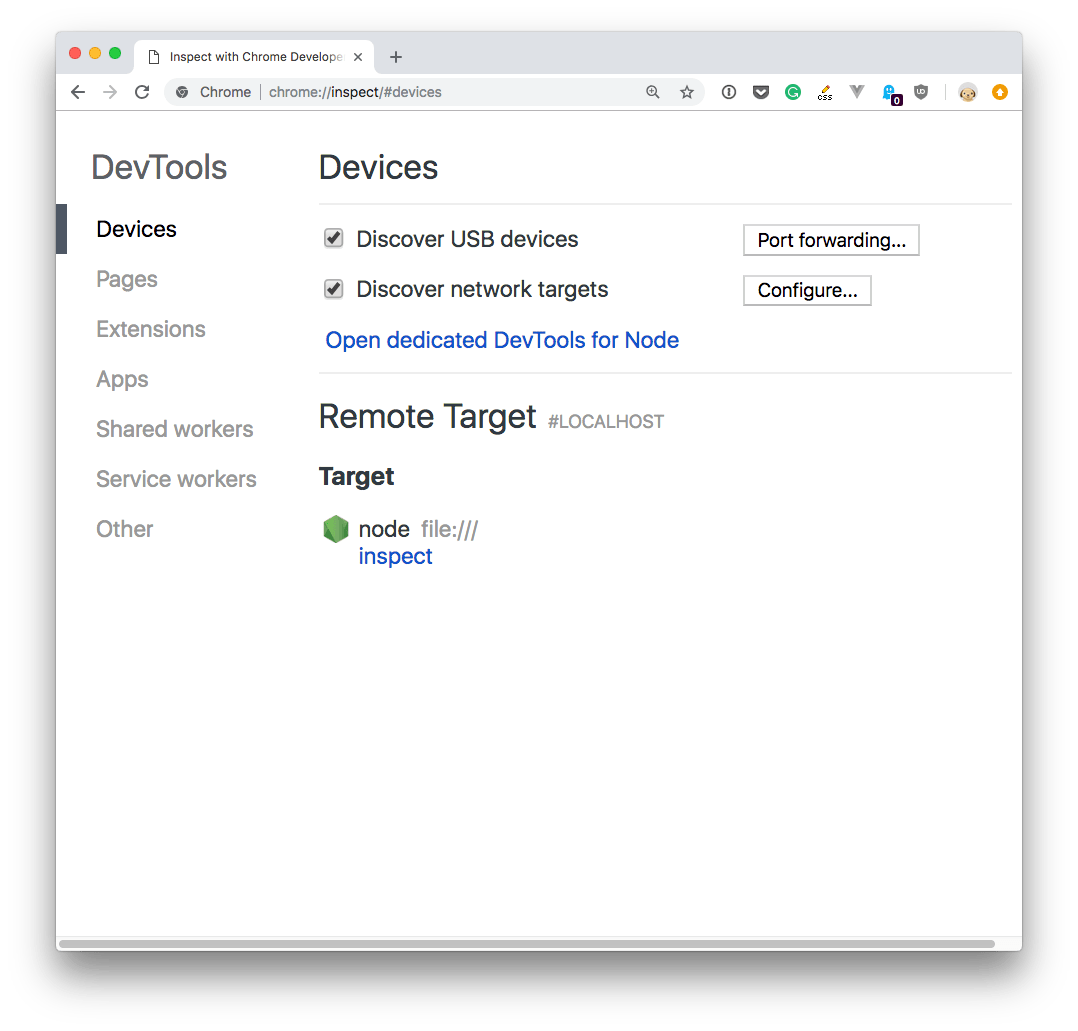
Click the Open dedicated DevTools for Node link next to the Node target, and you’ll have access to Node.js in the browser DevTools:
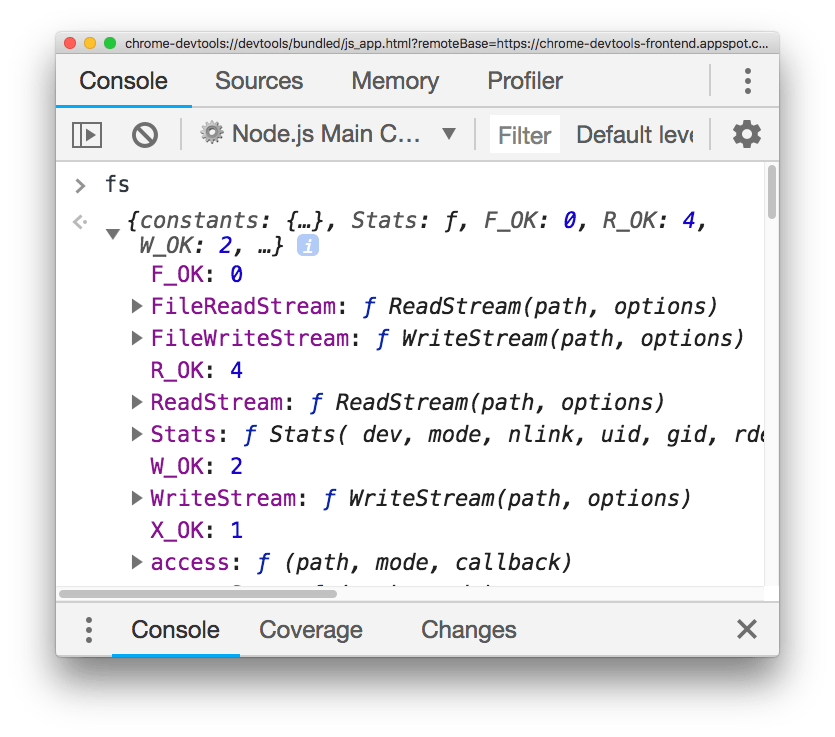
Make sure you click that, and not the inspect link down below, as it tool auto-reconnects to the Node.js instance when we restart it - pretty handy!
The Browser DevTools
I don’t think there was a time where websites and web applications were easy to build, as for backend technologies, but client-side development was surely easier than now, generally speaking.
Once you figured out the differences between Internet Explored and Netscape Navigator, and avoided the proprietary tags and technology, all you had to use was HTML and later CSS.
JavaScript was a tech for creating dialog boxes and a little bit more, but was definitely not as pervasive as today.
Although lots of web pages are still plain HTML + CSS, like this page, many other websites are real applications that run in the browser.
Just providing the source of the page, like browser did once upon a time, was not enough.
Browser had to provide much more information on how they rendered the page, and what the page is currently doing, hence they introduced a feature for developers : their developer tools .
Every browser is different and so their dev tools are slightly different. At the time of writing my favorite developer tools are provided by Chrome, and this is the browser we’ll talk here, although also Firefox and Edge have great tools as well. I will soon add coverage of the Firefox DevTools.
HTML Structure and CSS
The most basic form of usage, and a very common one, is inspecting the content of a webpage. When you open the DevTools that’s the panel the Elements panel is what you see:

The HTML panel
On the left, the HTML that composes the page.
Hovering the elements in the HTML panel highlights the element in the page, and clicking the first icon in the toolbar allows you to click an element in the page, and analyze it in the inspector.
You can drag and drop elements in the inspector to live change their positioning in the page.
The CSS styles panel
On the right, the CSS styles that are applied to the currently selected element.
In addition to editing and disabling properties, you can add a new CSS property, with any target you want, by clicking the + icon.
Also you can trigger a state for the selected element, so you can see the styles applied when it’s active, hovered, on focus.
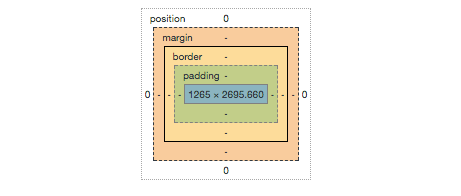
At the bottom, the box model of the selected element helps you figure out margins, paddings, border and dimensions at a quick glance:
The Console
The second most important element of the DevTools is the Console.
The Console can be seen on its own panel, or by pressing Esc in the Elements panel, it will show up in the bottom.
The Console serves mainly two purposes: executing custom JavaScript and error reporting .
Executing custom JavaScript
At the bottom of the Console there is a blinking cursor. You can type any JavaScript there, and it will be promptly executed. As an example, try running:
alert('test')
The special identifier $0 allows you to reference the element currently selected in the elements inspector. If you want to reference that as a jQuery selector, use $($0) .
You can write more than one line with shift-enter . Pressing enter at the end of the script runs it.
Error reporting
Any error, warning or information that happens while rendering the page, and subsequently executing the JavaScript, is listed here.
For example, failing to load a resource from the network, with information on why , is reported in the console.
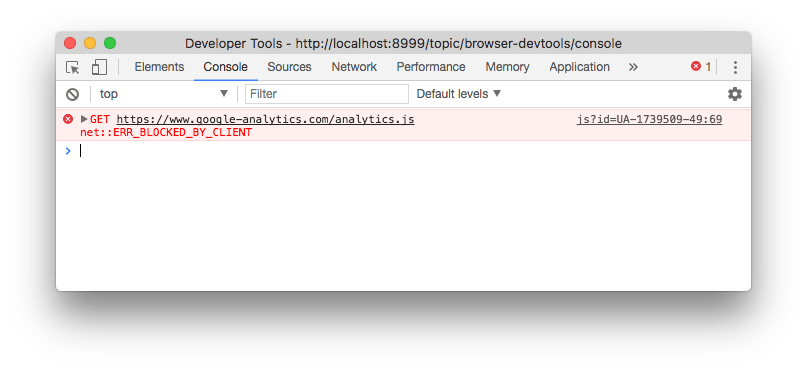
In this case, clicking the resource URL brings you to the Network panel, showing more info which you can use to determine the cause of the problem.
You can filter those messages by level (Error / Warning / Info) and also filter them by content.
Those messages can be user-generated in your own JavaScript by using the Console API:
console.log('Some info message')
console.warn('Some warning message')
console.error('Some error message')
The emulator
The Chrome DevTools embed a very useful device emulator which you can use to visualize your page in every device size you want.

You can choose from the presets the most popular mobile devices, including iPhones, iPads, Android devices and much more, or specify the pixel dimensions yourself, and the screen definition (1x, 2x retina, 3x retina HD).
In the same panel you can setup network throttling for that specific Chrome tab, to emulate a low speed connection and see how the page loads, and the “ show media queries ” option shows you how media queries modify the CSS of the page.
The network panel
The Network Panel of the DevTools allows you to see all the connections that the browser must process while rendering a page.
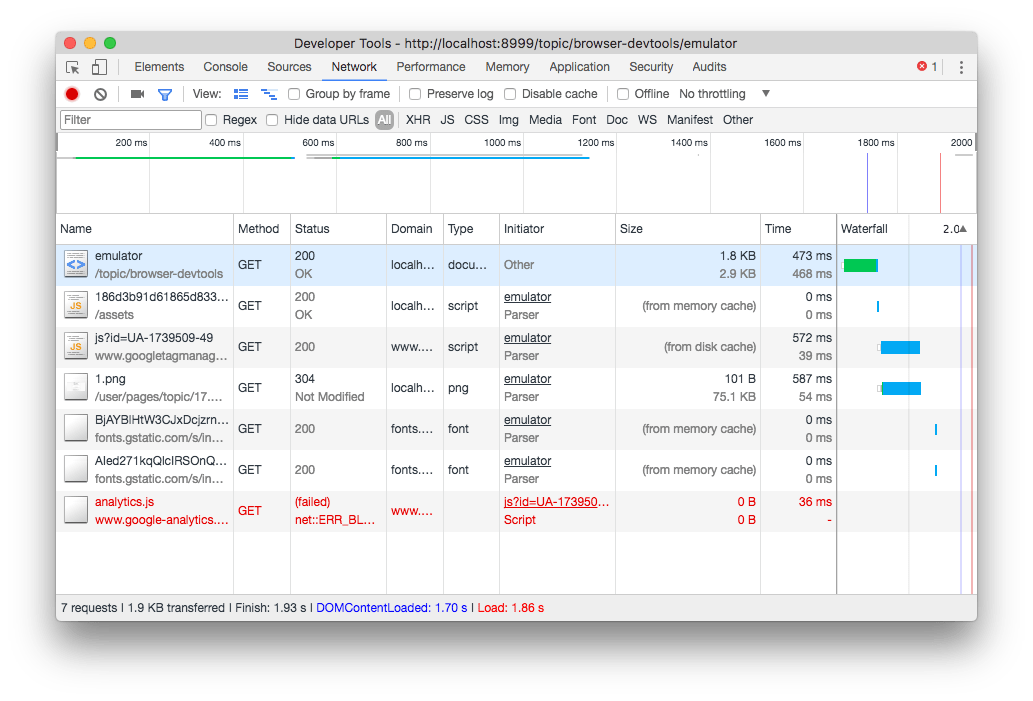
At a quick glance the page shows:
- a toolbar where you can setup some options and filters
- a loading graph of the page as a whole
- every single request, with HTTP method, response code, size and other details
- a footer with the summary of the total requests, the total size of the page and some timing indications.
A very useful option in the toolbar is preserve log . By enabling it, you can move to another page, and the logs will not be cleared.
Another very useful tool to track loading time is disable cache . This can be enabled globally in the DevTools settings as well, to always disable cache when DevTools is open.
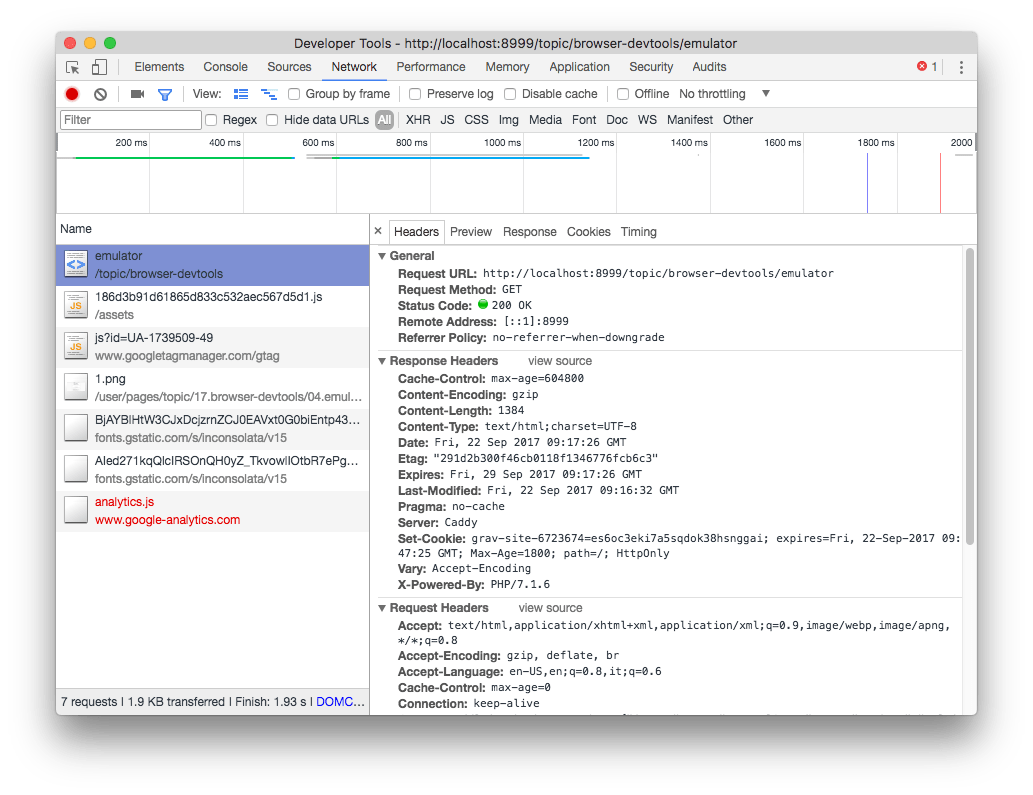
Clicking a specific request in the list shows up the detail panel, with HTTP Headers report:
And the loading time breakdown:

JavaScript debugger
If you click an error message in the DevTools Console, the Sources tab opens and in addition to pointing you to the file and line where the error happened, you have the option to use the JavaScript debugger.

This is a full-featured debugger. You can set breakpoints, watch variables, and listen to DOM changes or break on specific XHR (AJAX) network requests, or event listeners.
Application and Storage
The Application tab gives you lots of information about which information is stored inside the browser relative to your website.
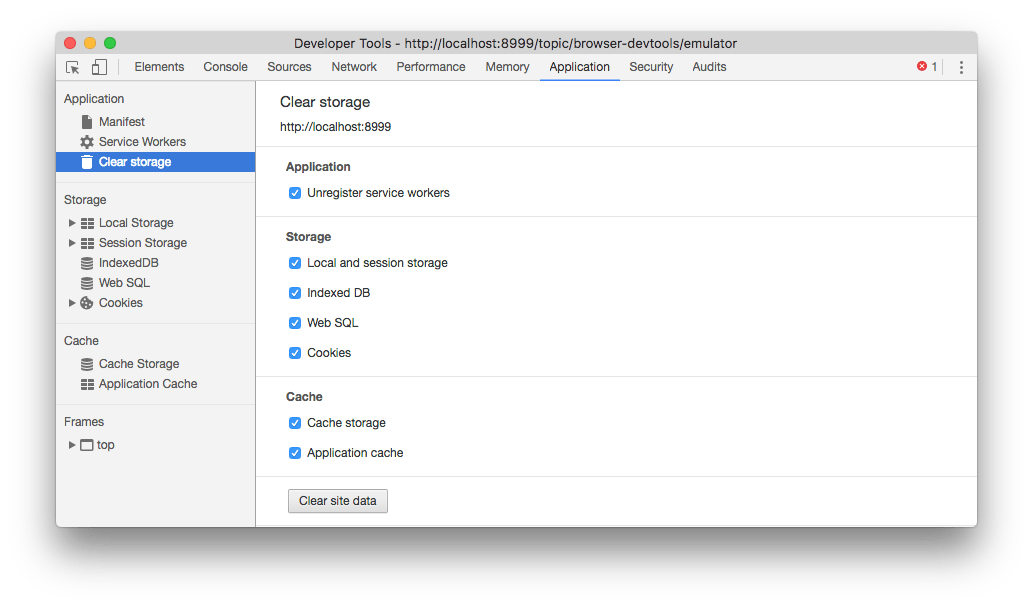
Storage
You gain access to detailed reports and tools to interact with the application storage:
- Local Storage
- Session Storage
- IndexedDb
- Web SQL
- Cookies
and you can quickly wipe any information, to start with a clean slate.
Application
This tab also gives you tools to inspect and debug Progressive Web Apps.
Click manifest to get information about the web app manifest, used to allow mobile users to add the app to their home, and simulate the “add to homescreen” events.
Service workers let you inspect your application service workers. If you don’t know what service workers are, in short they are a fundamental technology that powers modern web apps, to provide features like notification, capability to run offline and synchronize across devices.
Security tab
The Security tab gives you all the information that the browser has relatively to the security of the connection to the website.
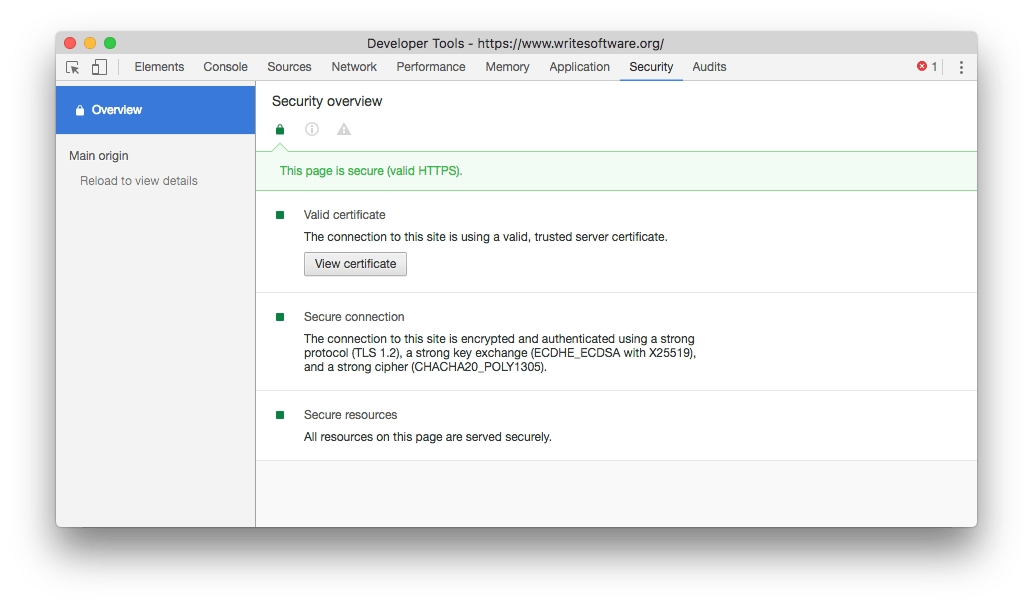
If there is any problem with the HTTPS connection, if the site is served over TLS, it will provide you more information about what’s causing it.
Audits
The Audits tab will help you find and solve some issues relative to performance and in general the quality of the experience that users have when accessing your website.
You can perform various kinds of audits depending on the kind of website:
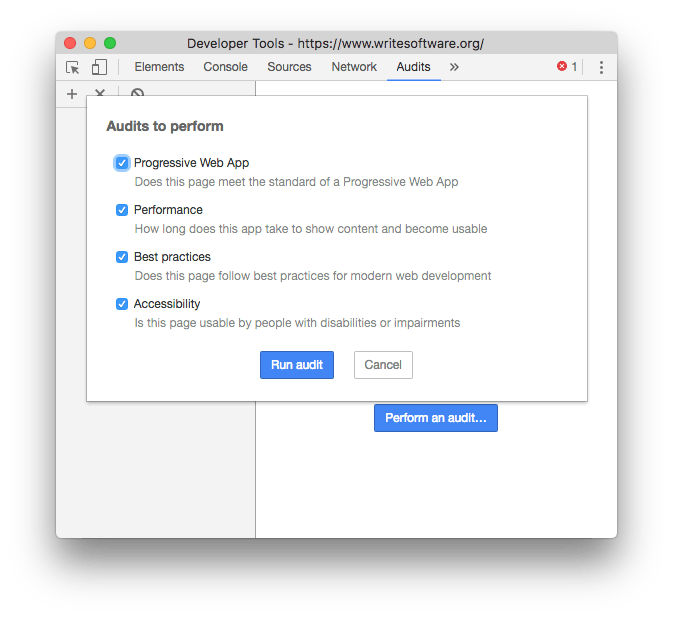
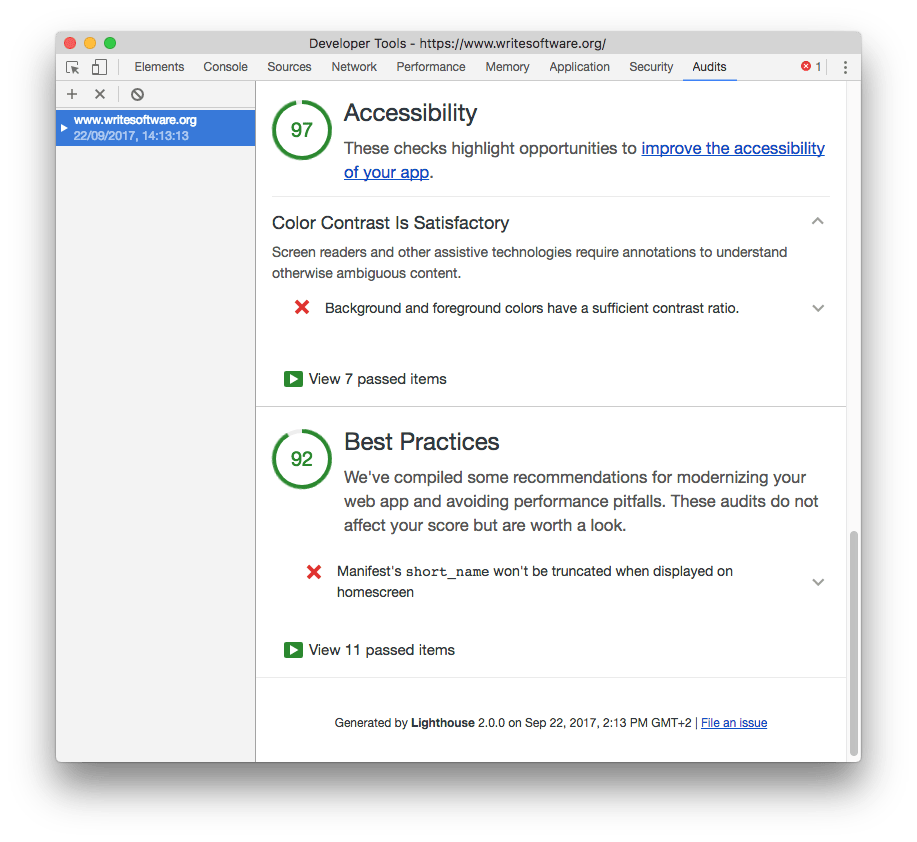
The audit is provided by Lighthouse, an open source automated website quality check tool. It takes a while to run, then it provides you a very nice report with key actions to check.
How to inspect a JavaScript object
While not part of the language , the browser and Node.js (the 2 main environment in which we execute JavaScript code) expose the Console API, to which we can access using the console object.
Let’s say we have this object car , but we don’t know its content, and we want to inspect it:
const car = {
  color: 'black',
  manufacturer: 'Ford',
  model: 'Fiesta'
}
Using the Console API you can print any object to the console. This will work on any browser. You can open the console in the browser in Firefox using the Tools -> Web Developer -> Web Console menu.
Here are the main ways to use it.
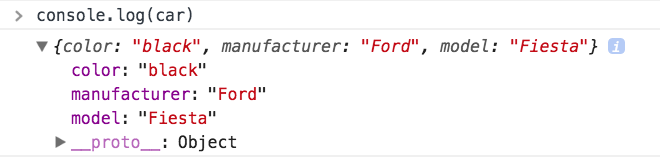
console.log
console.log(car)
console.dir
console.dir(car)
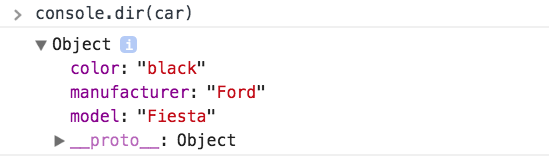
This works exactly like
console.log('%O', car)
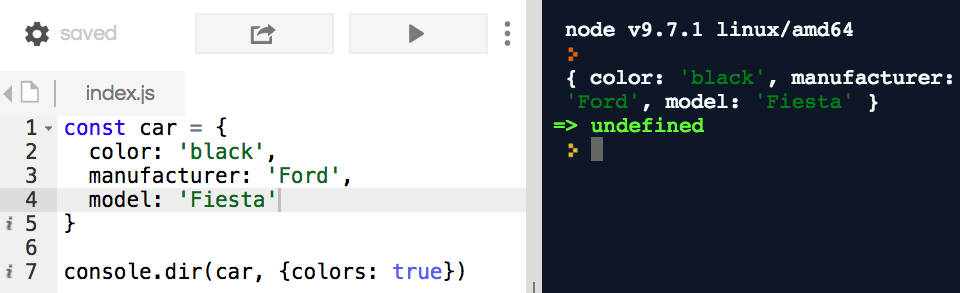
When debugging in Node.js you can add the colors property to print the object nicely:
console.dir(car, { colors: true })
JSON.stringify()
This will print the object as a string representation:
JSON.stringify(car)

By adding these parameters:
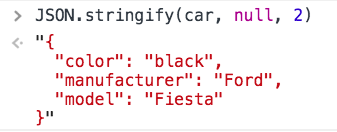
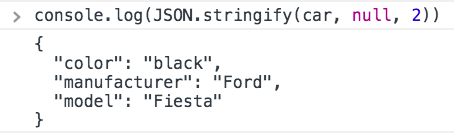
JSON.stringify(car, null, 2)
you can make it print more nicely. The last number determines the amount of spaces in indentation:
JSON.stringify() has the advantage of working outside of the console, as you can print the object in the screen. Or, you can combine it with the Console API to print this in the console:
console.log(JSON.stringify(car, null, 2))
toSource()
Similar to JSON.stringify, toSource() is a method available on most types, only in Firefox (and browsers based on it):
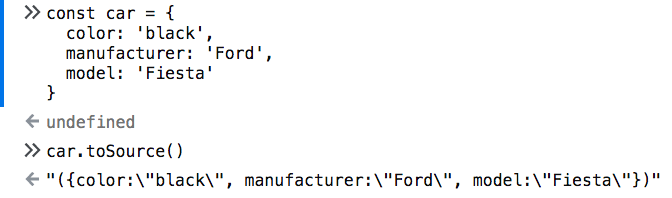
Worth mentioning, but not being a standard, and only being implemented in Firefox, makes JSON.stringify a better solution.
Iterate the properties using a loop
The for...in loop is handy, as it prints the object properties:
const inspect = obj => {
  for (const prop in obj) {
    if (obj.hasOwnProperty(prop)) {
      console.log(`${prop}: ${obj[prop]}`)
    }
  }
}

inspect(car)
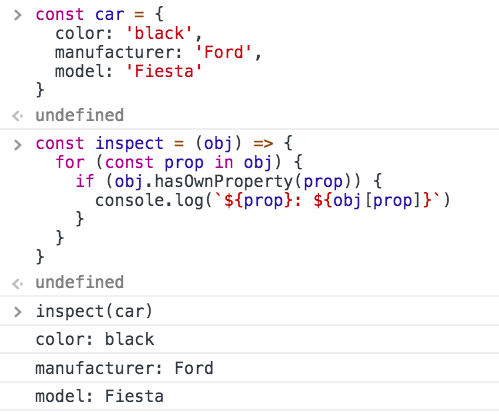
I use hasOwnProperty() to avoid printing inherited properties.
You can decide what to do in the loop, here we print the properties names and values to the console using console.log , but you can adding them to a string and then print them on the page.
Exceptions
When the code runs into an unexpected problem, the JavaScript idiomatic way to handle this situation is through exceptions.
Creating exceptions
An exception is created using the throw keyword:
throw value
where value can be any JavaScript value including a string, a number or an object.
As soon as JavaScript executes this line, the normal program flow is halted and the control is held back to the nearest exception handler .
Handling exceptions
An exception handler is a try / catch statement.
Any exception raised in the lines of code included in the try block is handled in the corresponding catch block:
try {
  //lines of code
} catch (e) {

}
e in this example is the exception value.
You can add multiple handlers, that can catch different kinds of errors.
finally
To complete this statement JavaScript has another statement called finally , which contains code that is executed regardless of the program flow, if the exception was handled or not, if there was an exception or if there wasn’t:
try {
  //lines of code
} catch (e) {

} finally {

}
You can use finally without a catch block, to serve as a way to clean up any resource you might have opened in the try block, like files or network requests:
try {
  //lines of code
} finally {

}
Nested try blocks
try blocks can be nested, and an exception is always handled in the nearest catch block:
try {
  //lines of code

  try {
    //other lines of code
  } finally {
    //other lines of code
  }

} catch (e) {

}
If an exception is raised in the inner try , it’s handled in the outer catch block.
Quiz
Welcome to the quiz! Try to answer those questions, which cover the topics of this module.
You can also write the question/answer into the Discord chat, to make sure it’s correct - other students or Flavio will check it for you!
- which devtools panel is going to be helpful to check the JavaScript files size?
- which devtools panel is going to help debugging a script and figuring why a particular value has been assigned to a variable
- describe what is a breakpoint and how is it useful when debugging
- what is an exception? why would we want to throw an exception?