How to solve problems?
In this section I want to introduce the concept of solving problems using pseudo code.
When we have a problem that can be solved with code, as programmers we are tempted to jump straight into code.
Because that’s how most self learning works, and also most coding bootcamps, which want you to feel you are progressing quickly.
I attended a technical high school, where we had plenty of time to learn things the right way - I think.
This way I’m talking about is thinking before you type any line of code.
Sounds unusual, right? But this is how it works in most professions. When building a house, months of work go into careful planning. You don’t see people digging before you know what you’ll build.
Let’s see how to do that.
Algorithms
Algorithms are the procedure used to solve any problem using pseudo code.
Most algorithms can be described using pen and paper, or - as we have keyboard - a text editor.
I like the simple route.
When you have a problem at hand, even a simple one, think out loud and write down all the things you must take care of.
If you start with the simple algorithms, you will train to be able to solve the more difficult ones later on.
In the “The Main Concepts” module, lesson Algorithms, I introduced some special kinds of pre-made algorithms which are usually studied in Computer Science, and commonly asked at coding interviews.
These algorithms I’m talking about now are different. I’m talking about creating new algorithms to solve new problems .
Creating an algorithm is like writing code.
Except you don’t have to worry about syntax, and you can use whatever visual instrument you like. Even pieces of paper, stickies and draw arrows.
To me, using pen and paper makes the problem more concrete. More real. And thus, easier to reason about, and easier to solve.
There is one really nice way to represent algorithms, which can help both to formalize an algorithm once you defined it, or also to help you define it in the first place.
It’s called flow charts .
Flow charts
Flow charts are one visual tool we can use to visualize any algorithm using a special set of illustrations.
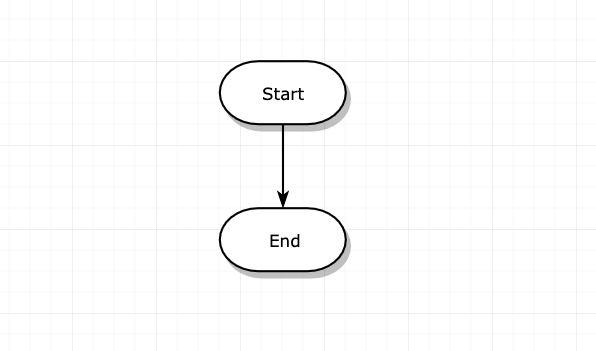
Every flow chart has a beginning, and an end. An arrow determines the direction of the flow:
I use draw.io to make those graphs, but you can use whatever other tool you like.
In the middle, that’s where the magic happens.
We identify each step of the sequence with a squared box:

Every time you are facing a choice, a diamond box contains a question, and can point to a different flow depending on the answer. Once the 2 roads can meet again, we add a circle:
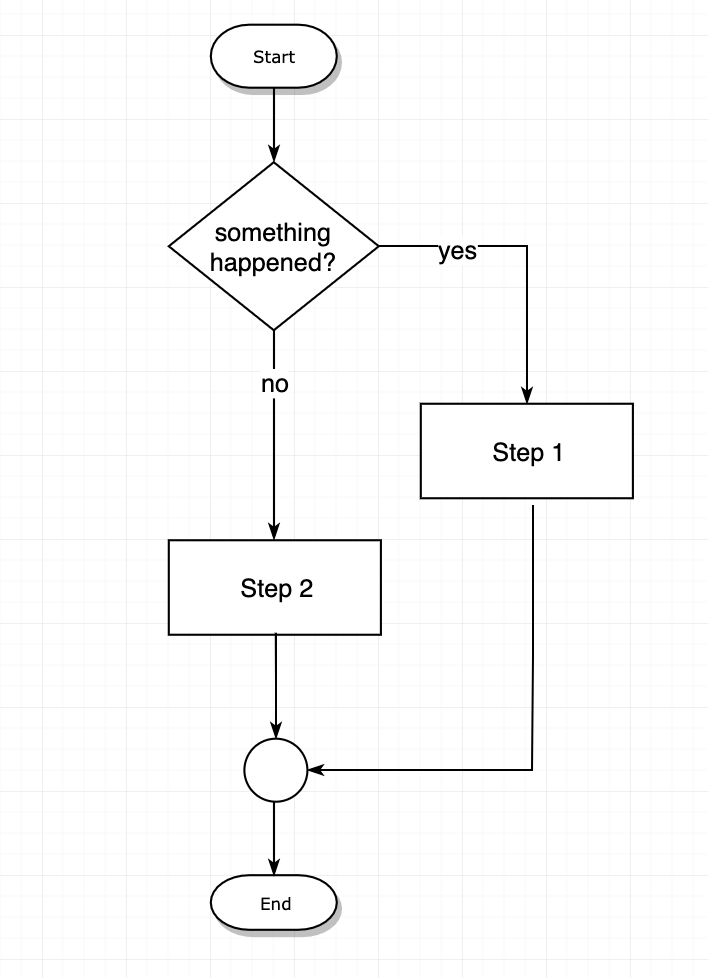
That’s basically it. You can use other symbols to identify special things happening, like I/O with parallelograms, but it’s not an essential part of it.
In the next lessons we’ll see 3 practical examples of using flow charts to describe algorithms.
An example flow chart
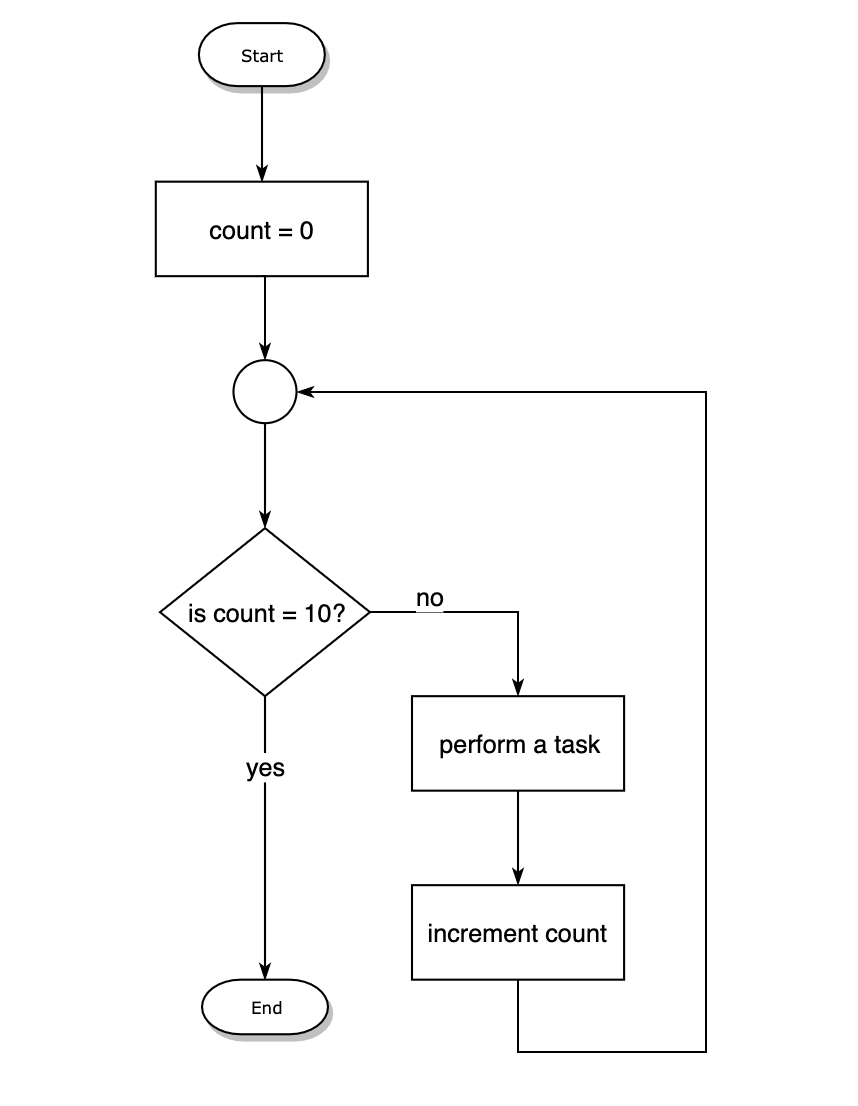
In this lesson I want to build with you a flow chart example. I want to create a flow chart for a loop.
We initialize a count variable, and we “perform a task” for 10 times.
We increment the the count variable every time we execute the task, so to end the loop we check if it’s equal to zero.
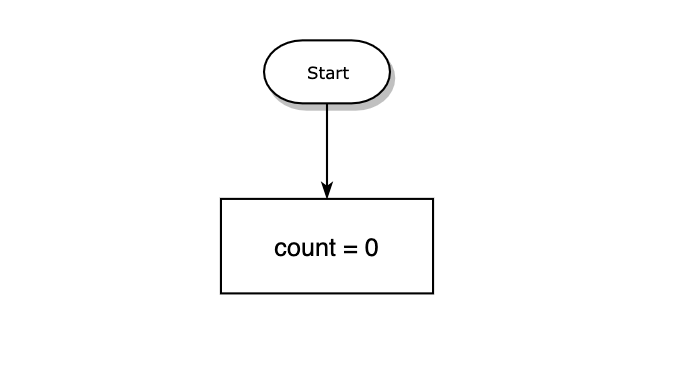
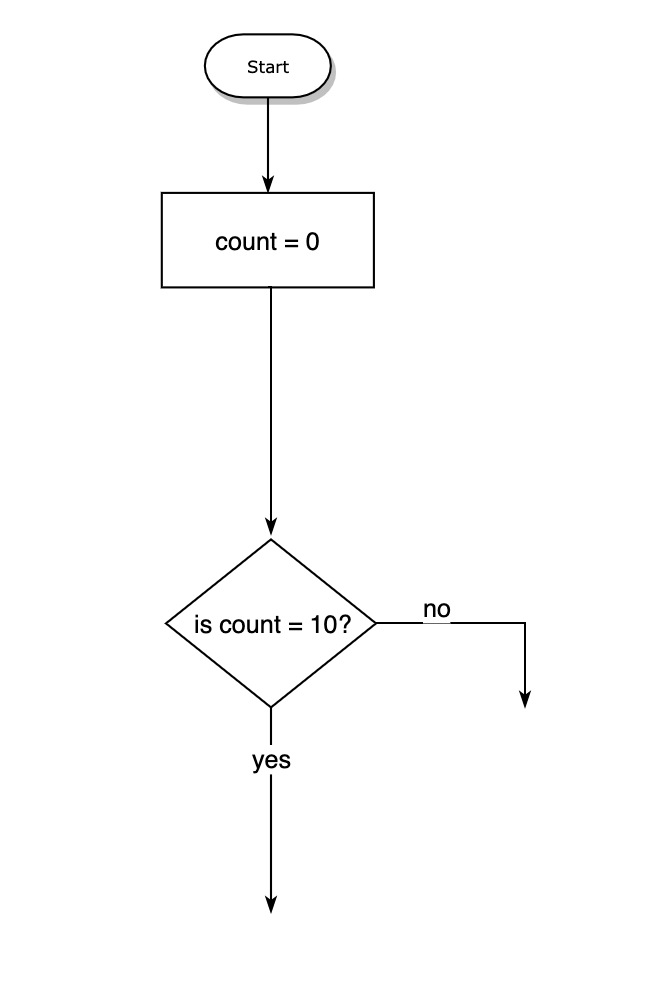
Let’s start by defining this count variable:
Then we create a conditional block, checking if count is equal to 10. If so, we’ll go down, and if not so, we’ll go right:
At this point we can add the additional logic. If the count is 10 we end the program, but until it’s not 10, we “perform a task” and then increment the count variable amount: