1. Image Performance on the Web
Lesson #1: Image Performance on the Web
Image performance, network and render performance costs. Image inspection tricks with DevTools. Responsive image linting. Image generation in Gulp.
Lesson Details
- Lesson: 1
- Description: Image performance, network and render performance costs. Image inspection tricks with DevTools. Responsive image linting. Image generation in Gulp.
 Tip: Make sure you play this video in HD!
Course Notes
Welcome to Modern DevTools. Let me know what you think!
Lesson Goal : Understand why smaller images are beneficial
What we’ll cover
- The cost of images (Both on the Network & Render side)
- Image srcset - what it does and how it works
- DevTools tricks with responsive images
- Linting responsive images
- Conclusion
The cost of images
Network
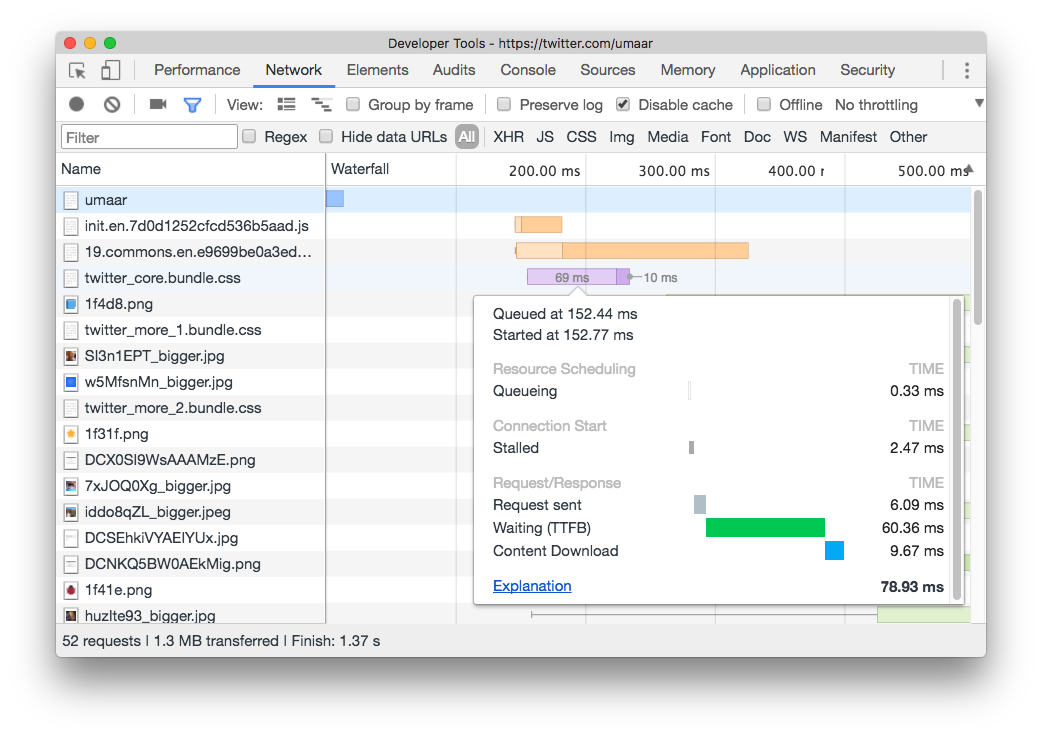
Use the Network Panel to understand the download time of images.
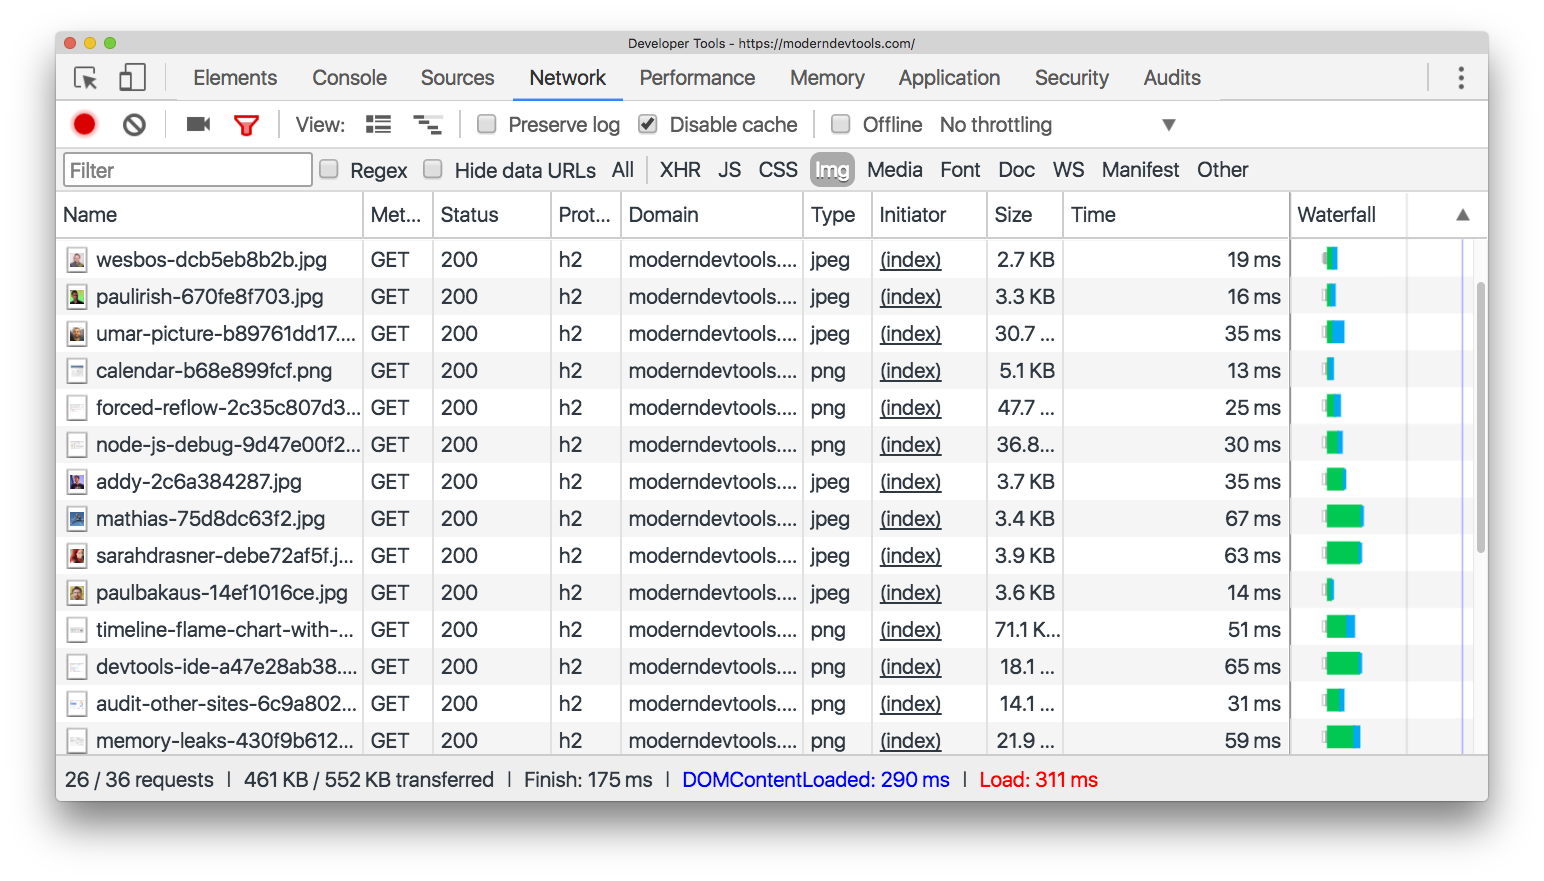
Tip : Use the larger-than Network panel filter to quickly find big resources. See Dev Tips #55 or the full list of filters in the official docs.
You can also view the financial cost on whatdoesmysitecost.com.
Render
The “render” cost, in our context, represents the time it takes for a browser to “draw” the image to the screen. Once an image has been downloaded from the network, the browser will spend more time decoding that image and drawing it to the screen. Traditional website performance recommendations focus heavily on the network. In 2017, with better developer tooling, we can begin to understanding timings after an image has been downloaded.
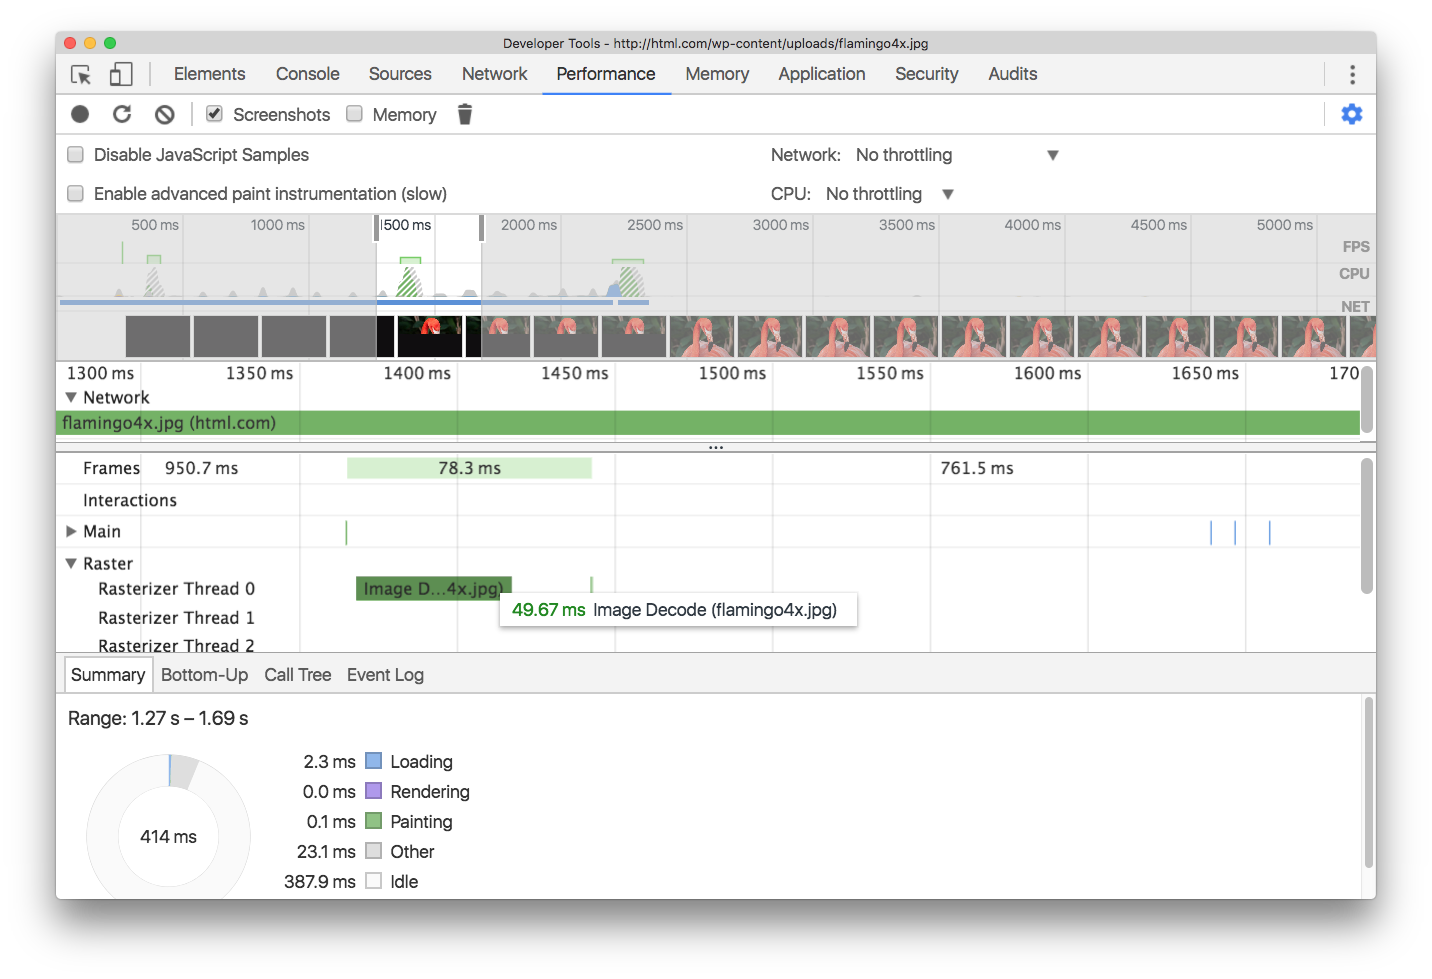
Image Decode
Image Decode is an operation the browser performs on an image to prepare it for displaying to you, the user. An overlooked performance aspect with images is the duration of this operation. Note: Image decoding may take ~5ms with a small image on a powerful machine, however it’s a different story on a low-end device + large image.
The cost of image decoding on a Nexus 4 is even greater

You can debug on mobile devices with Remote Debugging.
Image srcset
Before we dive into what srcset is, take some time to understand the problem it can solve.
Have a look at the images I’ve used on the course landing page. For example the raw image forced-reflow.png has a width of 912px, however on a large screen, I only display it at 680px. Also, on a narrow viewport size, for example when the viewport width is at 320px, the image width is constrained to 270px.
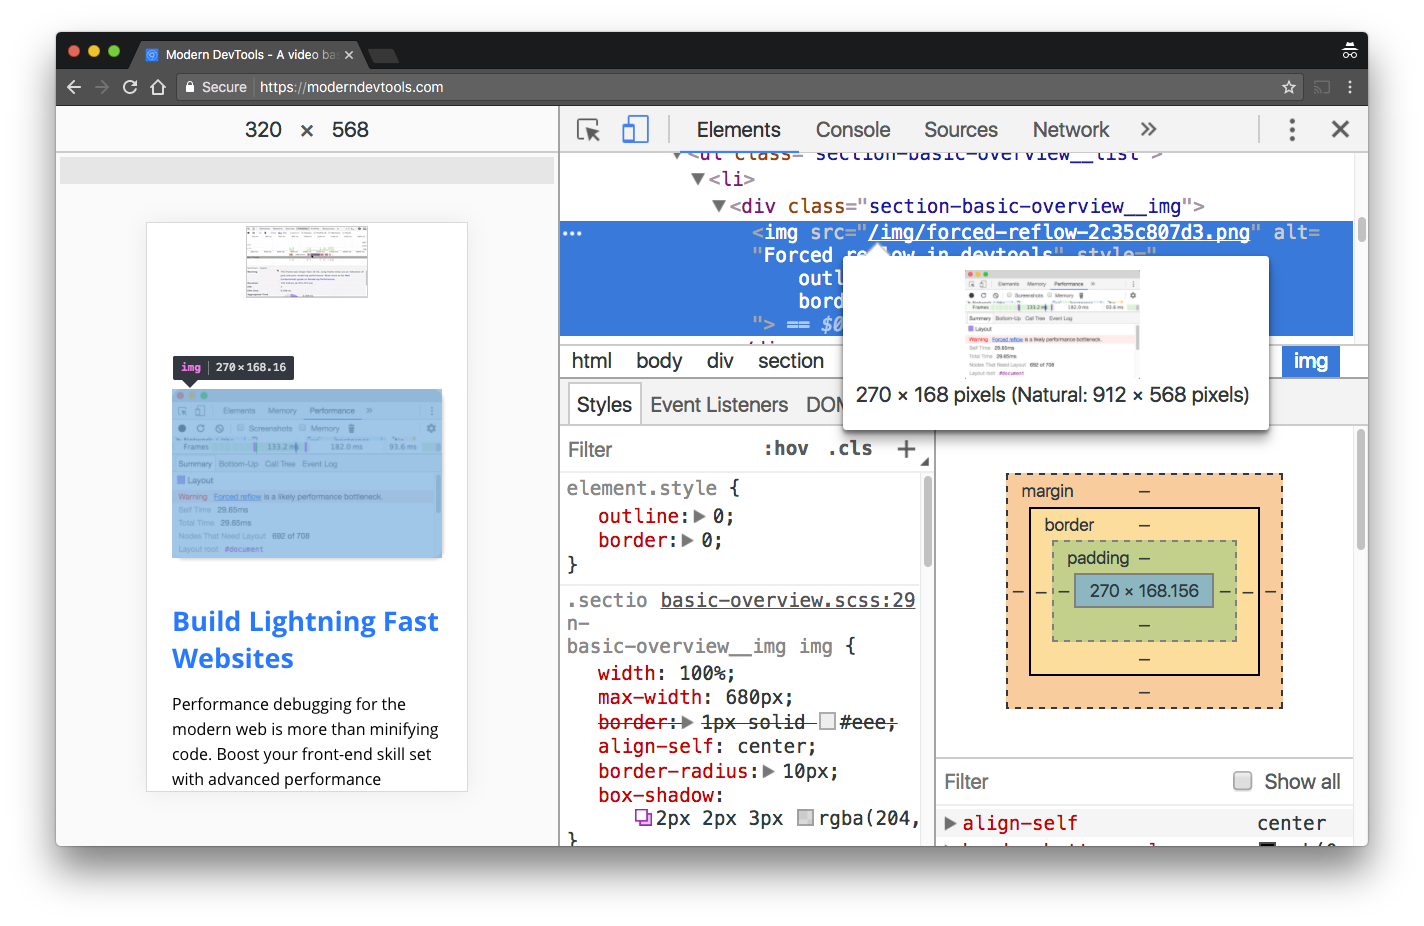
The problem is, I’m sending a single, high-quality image down to the user, regardless of what size it will be displayed at. It would be like downloading a 4K video from YouTube, but then watching it at 480p!
srcset, an attribute for the img tag, can help us solve this.
What srcset is
The srcset attribute extends the img element, so you can supply multiple image files for difference device characteristics.
How srcset works
<!-- You can say -->
<img src="img.jpg">

<!-- But with srcset, we can hint to the browser certain things -->
<img srcset="small.jpg 400w, medium.jpg 800w">

<!-- Device pixel ratio -->
<img srcset="small.jpg 1x, medium.jpg 2x">
Challenge
- Try resizing the viewport and observe in which cases the image changes, and in which cases it doesn’t, how does a browser reload play into this?
- For experiment no.1, we observe the image itself changed. If there are no significant visual changes in
srcsetimage variations, can you discover two ways to grab the activesrcsetimage from DevTools? (Hint: Properties Pane &getEntriesByType)
Responsive Image Linting
Try it out (github.com/ausi/respimagelint)
Update: Lighthouse can now perform responsive image linting.
Conclusion
With images, we pay a cost on both the network and render side. Use the Network Panel and Performance Panel to quantify these costs.
<h3>Srcset</h3>
Srcset provides image metadata which the browser didn’t already have.
Browser support - All modern browsers! Yes for edge, but no for IE.
Gulp responsive generate multiple image variations (small.jpg, medium.jpg, large.jpg) at build time
2. Visualise JavaScript performance metrics
Lesson Details
- Lesson: 2
- Description: Report and visualise custom performance metrics
The goal of this lesson
Understand how to visualise JavaScript performance.
What we’ll cover
- Real User Monitoring
- What, why and how
- User Timing API
- Plus code examples
- Tooling
- Conclusion
Real User Monitoring
RUM is unlike synthetic monitoring which traditionally simulates user behaviour on a website.
What
RUM monitors actual user metrics. In our use case, we’re focussed on performance metrics, for example JavaScript parse time.
Why
With synthetic monitoring, no real users are actually involved - performance is typically predictable with no extra insight. With RUM, you can understand what your users experience in reality. You can discover errors not caught in development/staging/QA environments.
You could have great test coverage, passing load tests, lots of automated functional tests, a smooth continuous deployment process, but even with all of that, your users can still get a poor experience because one of your CDNs serving to a particular geographic region is too slow.
Why care about deeper metrics? Why go deeper than just DOMContentLoaded
DOMContentLoaded , onload etc. events do not give the full picture. For example, we should care about the visual completeness of a page, which the previously mentioned events do not answer for us. We also need to care about a webpages lifecycle, especially when page navigation is taken over by Ajax.
How
One example of collecting custom user metrics is to find a piece of JavaScript which you suspect can be slow, and then profile it. To profile it, you can do the following:
const start = new Date().getTime();
// Expensive operation here which we are "timing"
const now = new Date().getTime();

const duration = now - start;
With the result ( duration ), you can report this back to your web servers for further analysis.
User Timing API
What
An API to log timestamps (marks) and durations (measures)
Why
The User Timing API is superior to the technique we saw earlier: using new Date() to profile JavaScript snippets. One reason is that JS timers are not always accurate.
The User Timing API is better because it:
- Has increased reliability over
new Date()techniques. - Can easily feed into many performance tools including browser DevTools in a standard way.
- Uses sub-millisecond resolution by default.
How
performance.mark("Start");

let myCounter = 0;

for (let i = 0; i < 1000000; i++){
    myCounter++;
    document.querySelector('IDoNotExist');
}

performance.mark('End');

performance.measure('Some name', 'Start', 'End');

performance.getEntriesByType('measure');
Tooling
DevTools
Points to notice:
- Notice: How ‘with script boundaries’ represents the parse, eval + compile time
- Notice: bigcode.js appears to start before the ‘with script boundaries’ marking begins
- Why? Possibly the pre-scanner
- Notice how the parsing of HTML can only continue once ‘with script boundaries’ ends. This is a great way to visualise what a “blocking script” is.
- Notice: Parse HTML event shows you the range of HTML
- Notice: First Meaningful Paint (small marker in the Frames)
Lighthouse
WebPageTest
https://www.webpagetest.org/result/170507_EH_cee9836683fc171510e5c0fd0033fa11/
Bookmarklet
Other
Conclusion
- Use this to improve user experience
- Report performance metrics back to your users and take action
- How about a “This page took unusually long to load. We’re looking into it”
- Global browser support is at +80%
3. Handling JS performance metrics
Tip: Want to change the playback rate? Inspect the <video> element below in DevTools and type in $0.playbackRate = 1.5 in the console panel. Vimeo’s own player doesn’t have speed controls.
Lesson Details
- Lesson: 3
- Description: Identifying where to record performance metrics, and sending these metrics back to your server
The goal of this lesson
Locate pieces of code for performance profiling and send the results back to your server.
What we’ll cover
- Profiling part of a real world app
- Using the User Timing API to log costly JavaScript
- Sending performance metrics to your Node.js server
- Using the Performance Observer API
- Conclusion
Profiling part of a real world app
With this technique, you can intelligently profile a real world app which you haven’t used before.
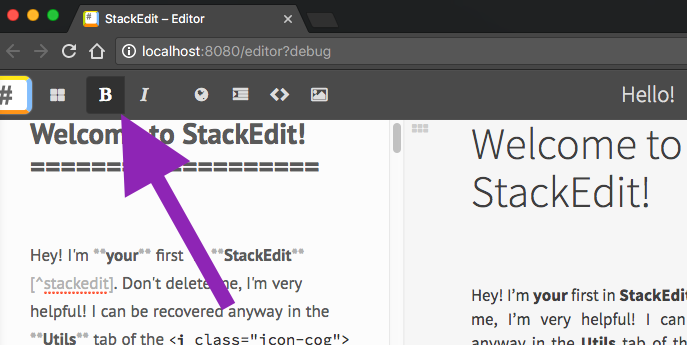
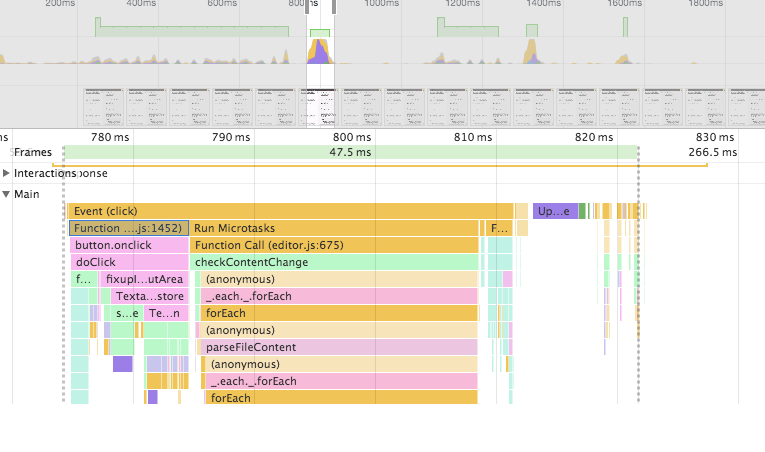
Using StackEdit (a web based Markdown editor) as a “real-world” example, we will profile the simple action of making text bold .
You can follow the StackEdit instructions from Github to run it locally.
To profile with DevTools:
- Highlight some text in the markdown editor.
- Start a Performance Panel recording.
- Make the text selection bold from the Markdown editor toolbar.
- Stop the recording.
Identify the two overall chunks of costly JavaScript in the main thread. With the Screenshots checkbox checked, you can hover over the screenshots with your mouse to understand what the page was doing at that particular time.
Using the User Timing API to log costly JavaScript
In the Performance Panel recording, locate a high-level rectangular bar (a function call near the top of the stack) to find an ideal location for a performance measurement.
Add Performance Markings in the app. For example, this code:
new MutationObserver(checkContentChange);
can transform into:
new MutationObserver(() => {
    performance.mark('checkContentChangeStart');

    // The costly function
    checkContentChange();

    performance.mark('checkContentChangeEnd');
    performance.measure(
        'checkContentChange',
        'checkContentChangeStart',
        'checkContentChangeEnd'
    );
});
If you re-run the profiling steps from above, you should now see rectangular bars, where the width represents time, in the User Timing section of a Performance Panel recording.
Sending performance metrics to your Node.js server
A quick and easy approach would be to use the performance.getEntriesByType('measure') API that we saw in lesson #2 to ajax results back to your server, for example as query string data. There are also established and mature tools out there to do this.
We will use the following tools:
- Boomerang - a client side JS tool to collect & report performance metrics.
- Boomerang’s UserTiming Plugin - to enable reporting of User Timing API markers and measures.
- User Timing Compression - to compress metric data before it is sent over the network. Also to decompress metric data when we wish to view it.
- Boomcatch - A standalone, Node.js-based beacon receiver for boomerang.
Require the following scripts:
<script src="https://cdn.rawgit.com/nicjansma/usertiming-compression.js/master/src/usertiming-compression.js"></script>
<script src="https://cdn.rawgit.com/SOASTA/boomerang/master/boomerang.js"></script>
<script src="https://cdn.rawgit.com/SOASTA/boomerang/master/plugins/usertiming.js"></script>
In your JavaScript entry point (e.g. main.js ), initialise the Boomerang plugin.
BOOMR.init({
    beacon_url: 'http://127.0.0.1:8081/beacon',
    UserTiming: {
        enabled: true
    }
});
Confirming Boomerang can beacon
Trigger some performance marks and measrures, and then try calling BOOMR.sendBeacon() to observe an attempted network request in the Network Panel.
We need to set up a web server which can receive and interpret these metrics.
Set up Boomcatch:
const boomcatch = require('boomcatch');

boomcatch.listen({
    port: 8081,
    path: '/beacon',
    log: console
});
When you start the server above, retry the steps in “Confirming Boomerang can beacon”. You should see logs which include your User Timing data.
In a short amount of time, you have been able to receive performance metrics on a Node.js server. To make sense of the data, we can add “mappers” and “forwarders” in Boomcatch.
const boomcatch = require('boomcatch');
const path = require('path');

boomcatch.listen({
    port: 8081,
    path: '/beacon',
    log: console,
    mapper: path.resolve('./mapper'),
    forwarder: path.resolve('./forwarder')
});
mapper.js can turn the data into something more useful.
const UserTimingDecompression = require('./node_modules/usertiming-compression/src/usertiming-decompression.js');

module.exports = {
    initialise() {
        return map;
    },
    type: 'json'
};

function map (data, referer, userAgent) {
    if (data.usertiming) {
        data.usertiming = UserTimingDecompression.decompressFromString(data.usertiming)
    }

    return JSON.stringify(data);
}
forwarder.js can receive data from the Mapper . You might use it to send your data to, for example, StatsD.
function log (data, type, separator, callback) {
    console.log(data)
    callback(null, data.length);
}

exports.initialise = () => log;
Tip: Using the Performance Observer API
Observe for new performance marks/measures.
const perfObserver = new PerformanceObserver(list => {
    console.log(list.getEntries());
});

perfObserver.observe({entryTypes: ['mark', 'measure']});

performance.mark('Hi');
Conclusion
- To collect performance metrics from end-users, you can use the User Timing API to profile various JavaScript functions.
- Start with Performance Timeline recordings in your local environment to identify ideal candidates for profiling.
- Once you’ve added marks & measures, you could report it back to your server. There are existing tools and services to do this (including Google Analytics).
- Use the Performance Observer API to be notified when new Performance Marks/Measures have been registered.
4. Identifying paint costs
Lesson Details
- Lesson: 4
- Description: Identifying and understanding paint events and their performance costs
The goal of this lesson
To identify large paint costs, and explore one technique to decrease paint time.
What we’ll cover
- Introduction
- How to identify paint costs
- Understanding the paint event
- Conclusion
Introduction
Things to know about painting.
- To get pixels from your webpage onto the screen, the browser paints such pixels.
- When something changes, for example a new element appears in the webpage, the browser must paint the new item.
- If you change a property of an existing element, the browser must repaint that element.
- Painting is an expensive operation.
Paint is often unavoidable, but regardless, it is valuable to know how to profile paint operations.
How to identify paint costs
As an example, we will use the main logo from ponyfoo (it’s a great resource for learning too).
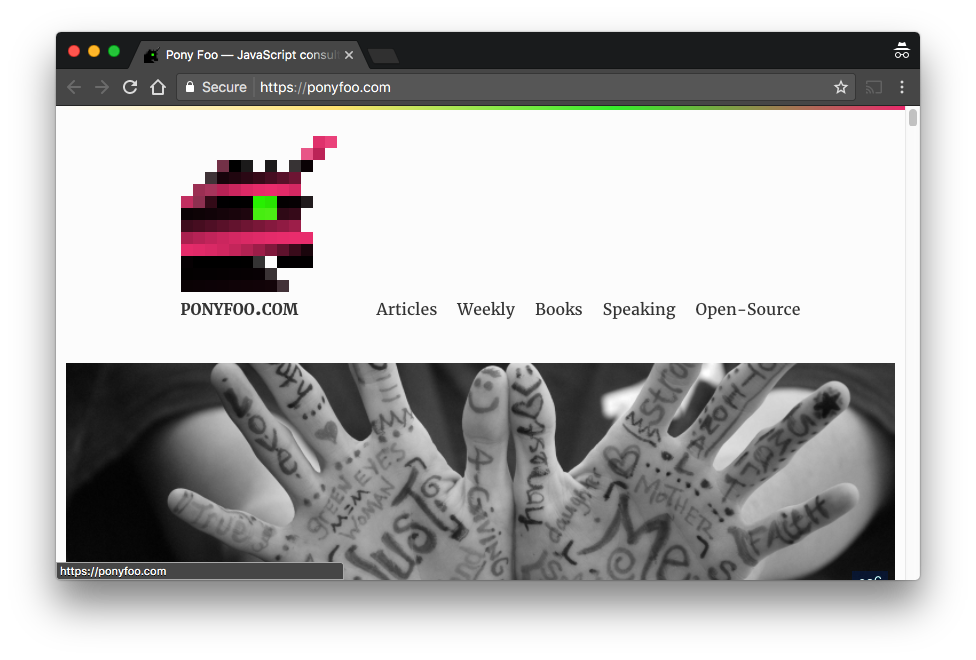
Hover over the logo and notice an animation kicks in. This animation changes the visual appearence of the logo, and therefore must be repainted.
To identify the paint cost:
- Start a Performance Panel recording
- Hover over the logo
- Stop the recording
- Zoom into the main thread
- Click on a paint event (coloured green)
Understanding the paint event
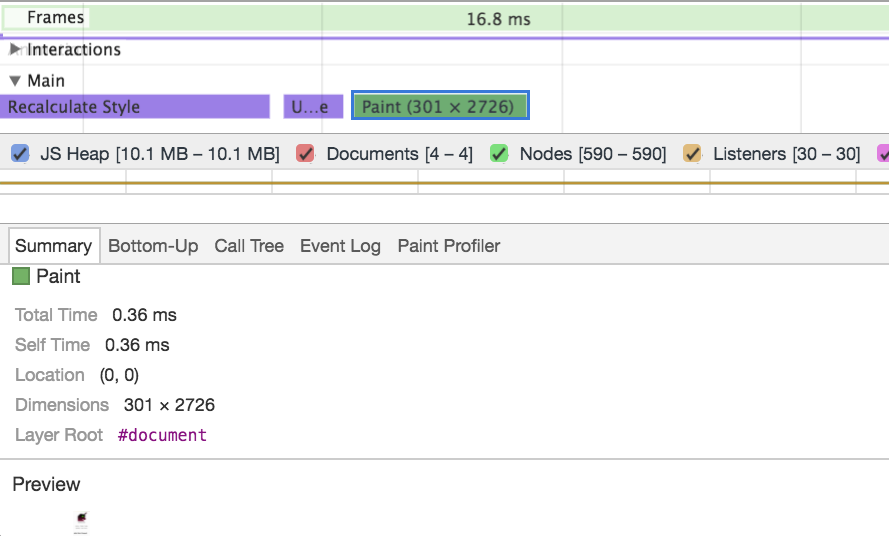
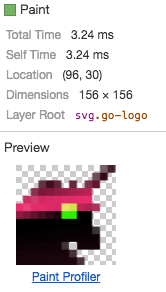
Notice you get granular information like:
- Paint time
- Location of the painted area
- Dimensions of the painted area
And more. You can click on the paint profiler to see the low-level calls which drew the page.
Notice for the paint event, even it was only the logo which needed repainting, DevTools reports the “Layer Root” as the document element. Hover over the paint event and notice the whole document highlights blue. This highlight indicates the affected portion of the page.
We can reduce some of the paint cost. Promote the logo to its own layer with the translateZ hack (e.g. a transform: translateZ(0); on the SVG ).
Warning:
- You must profile before and after. Layer creation comes at a cost.
- Do not prematurely optimise things.
- Consider using will-change instead.
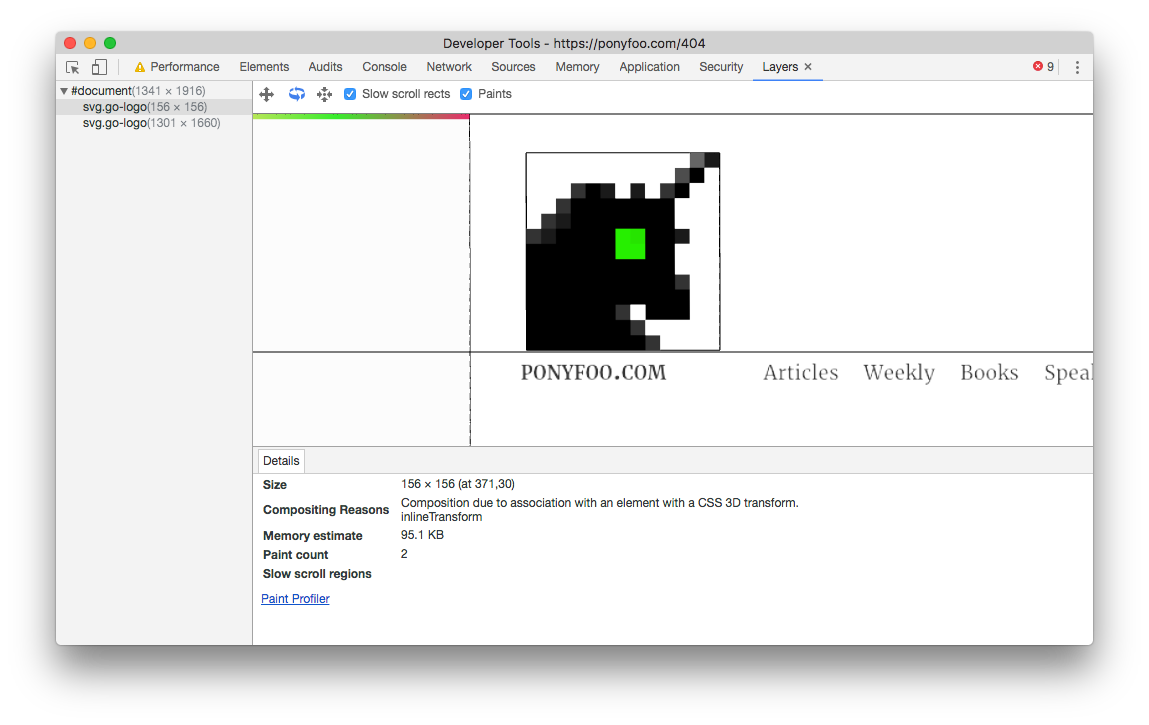
Rerun the instructions from “To identify the paint cost” and notice the layer root is now scoped to the SVG. The paint cost is now lower since there is less to paint.
You can also use the Layers Panel (Three dots in the DevTools toolbar > More Tools > Layers) to confirm the logo is on its own layer. The layers panel also displays a memory estimate for the layer.
As an experiment, you can recreate a similar logo, but instead of animating from one background-color to another, only animate the opacity. There is special internal browser behaviour when you animate opacity:
Changes to opacity can be handled by the GPU during compositing by simply painting the element texture with a lower alpha value.
And
In Blink and WebKit browsers a new layer is created for any element which has a CSS transition or animation on opacity
Quote from html5rocks
Conclusion
- If you do not identify an expensive cost, it might be unnecessary to optimise.
- DevTools displays a detailed summary of a paint event when you select it.
- Hover over your paint events, DevTools highlights the affected portions of the webpage within the viewport.
- Knowing when to promote a layer will be valuable during your performance optimisation journey.
5. A browser frame
Lesson Details
- Lesson: 5
- Description: Looking at browser frames, their events and their duration.
The goal of this lesson
To understand what a browser frame is, what it typically consists of, and how to visualise it in DevTools.
What we’ll cover
- Introduction
- What is a frame
- A frame in DevTools
- Creating some frame activity via JavaScript
- Conclusion
Introduction
Note: You can think of a ‘frame’ as the ‘frame’ in FPS
Why should you know what a frame is?
- It contains data we can use for performance debugging
- A frame which took too long will likely be noticeable to the user
- It’s an important concept in the performance panel
What is a frame?
A frame represents low level events which the browser had to complete to draw your webpage to the screen.
Using an analogy
Assume there is a single till at the supermarket. A queue of shoppers may form to purchase one or many items.
| Checkout process | Browser frame |
|---|---|
| Shopping basket contains items to be scanned | Frames contains events to be processed |
| Checkouts per second | Frames per second |
| A person with many items will take longer than a person with a single item | Normally, frames with a lot of activity will take longer than frames with little activity |
| A checkout can include different items | A frame can include different events |
| The worker at the till can only process one item at a time | Most browser events in a frame are handled synchronously |
| Everyone must wait for the current shopper to finish their checkout | One frame must complete before the next one begins |
A frame in DevTools
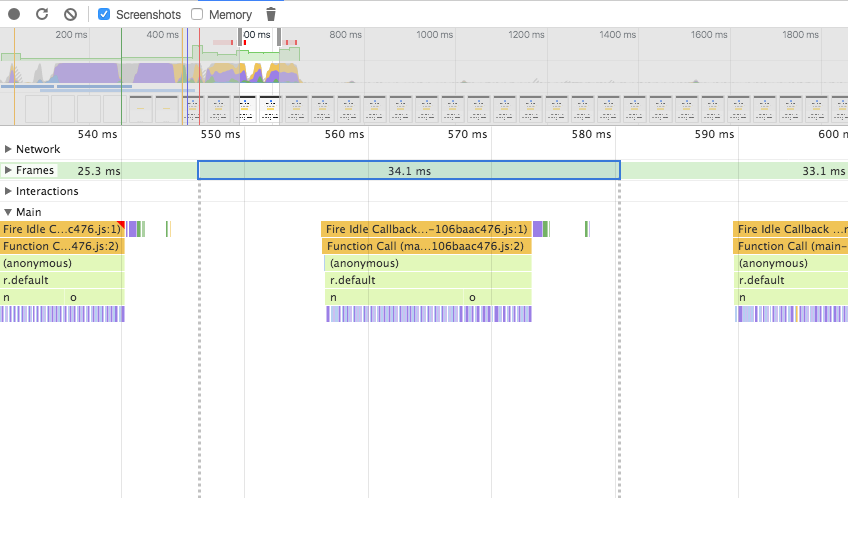
Note the long vertical dashed lines for frame boundaries
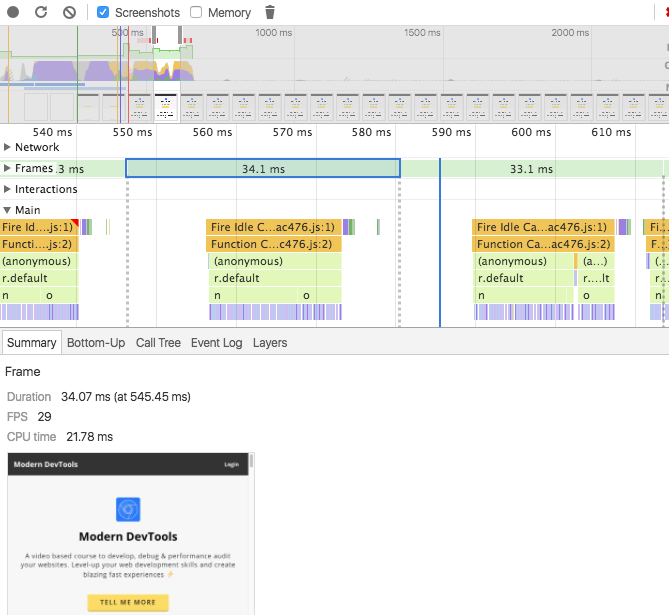
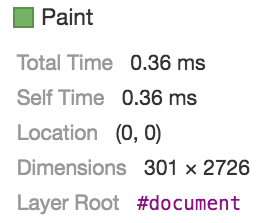
Frame timing
How to calculate the FPS based on a single frame duration.
To keep things looking smooth, the browser tries to keep up with a refresh rate of 60Hz by drawing frames 60 times per second (60 FPS). One second contains 1000 milliseconds. We can use this calculation to estimate how each frame can take in order to hit 60 FPS:
1000 / 60 = ~16ms
Therefore, each frame should take no longer than 16ms. Realistically, you should aim for less than 16ms per frame to account for other browser events you did not anticipate.
Frame events

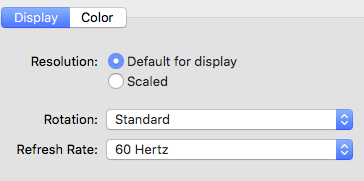
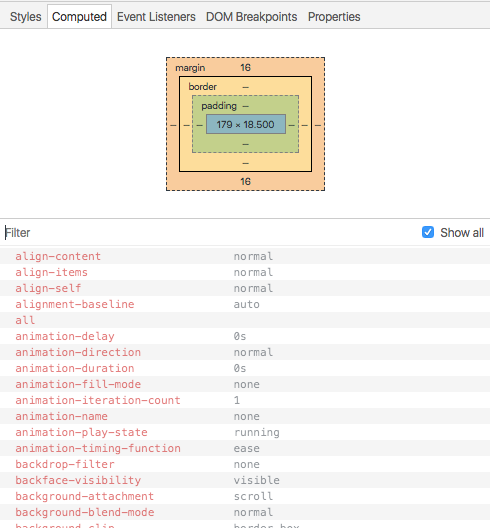
Side note: You can think of ‘Recalculate Style’ as the browser figuring out everything you see in the Computed pane in the elements panel.
Creating some frame activity via JavaScript
Let’s write some minimal JS to trigger most common events in a single frame.
const el = document.querySelector('.hello');

el.addEventListener('click', () => {
    requestAnimationFrame(() => {
        const newEl = document.createElement('p');
        newEl.innerHTML = 'Some text';
        document.body.appendChild(newEl);
    });
});
A performance recording of executing the above click handler looks like the image below.
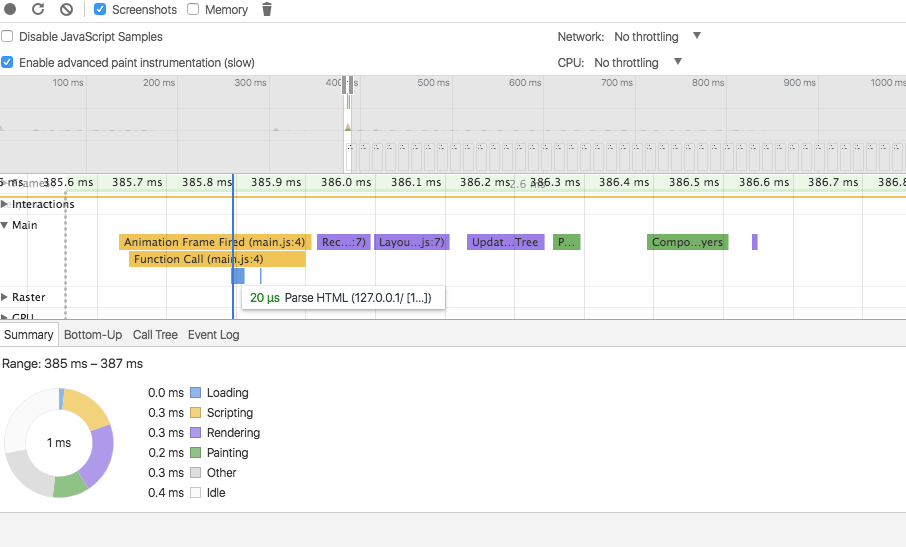
Conclusion
- A frame is a collection of work the browser must do to get your page on the screen.
- There are well defined events which may or may not occur in a single frame.
- Short frames will likely equate to a better user experience.
6. Node CLI debugging
Tip: Use a Chrome extension like Video Speed Controller to control the playback speed of videos.
Lesson Details
- Lesson: 6
- Description: Debugging a Node.js Command Line Tool
The goal of this lesson
To debug a Node.js CLI module and edit its contents via DevTools.
What we’ll cover
- Introduction
- Understanding the debug command to run
- Opening a DevTools instance for Node.js
- Live Editing JavaScript while paused at a breakpoint
- Conclusion
Introduction
It’s useful to inspect Node.js code when you want to make changes or learn from it. Modern versions of Node.js include V8 Inspector integration.
Understanding the debug command to run
Your goal is to run: node --inspect --debug-brk script.js
In the case of a global binary, like cowsay, you can find out the full path like this:
$ which clipboard

> /Users/user/.nvm/versions/node/v7.8.0/bin/clipboard
And then run node --inspect --debug-brk /Users/user/.nvm/versions/node/v7.8.0/bin/cowsay . In Node.js 8, you can use the flag --inspect-brk instead of --inspect --debug-brk .
Opening a DevTools instance for Node.js
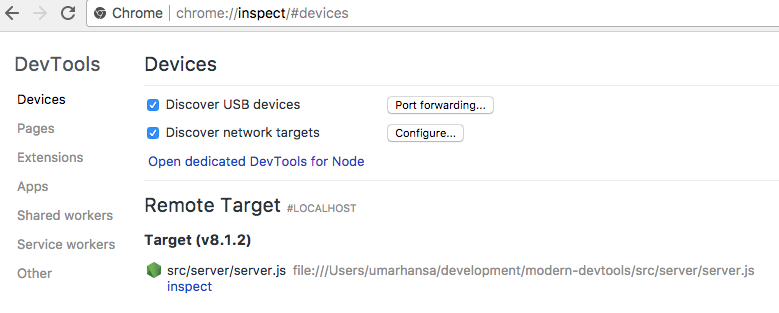
The DevTools toolbar notifies you when an active Node Debugging session is available. Click it to open a dedicated Node-DevTools instance.
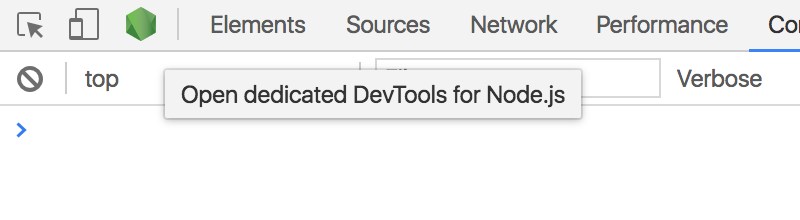
Alternatively, navigate to: chrome://inspect/ .
Live Editing JavaScript while paused at a breakpoint
When you are paused at a breakpoint, you can rewrite parts of the JavaScript and save your changes ( Cmd + S / Ctrl + S ). DevTools injects your changes into the JavaScript engine and in most instances, you can resume script execution to see your change applied.
Conclusion
- The flags to remember are:
--inspect --debug-brk. - Use the Node logo in DevTools or
chrome://inspect/to access your dedicated Node-DevTools instance. - You can live-edit JavaScript code while paused at a breakpoint.
7. Script Execution Cost
Lesson Details
- Lesson: 7
- Description: Identifying third-party script execution cost
The goal of this lesson
To easily understand script execution costs with and without third party scripts.
What we’ll cover
- Introduction
- Script download cost
- Script execution cost
- Request blocking
- Timeline History
- Conclusion
Introduction
When it comes to third party scripts, we often talk about the “cost” - where this term represents the download size over the network . However there is at least one other cost we pay for, this is the script execution cost .
Using DevTools, we can identify these metrics, specifically costs which come from third party scripts.
Script download cost
The Network Panel contains network related timings (which typically translates into costs for the user) for resources.
Whether a JavaScript resource is 1kb or 500kb , you should understand the weight a complex script can add to your page.
Script execution cost
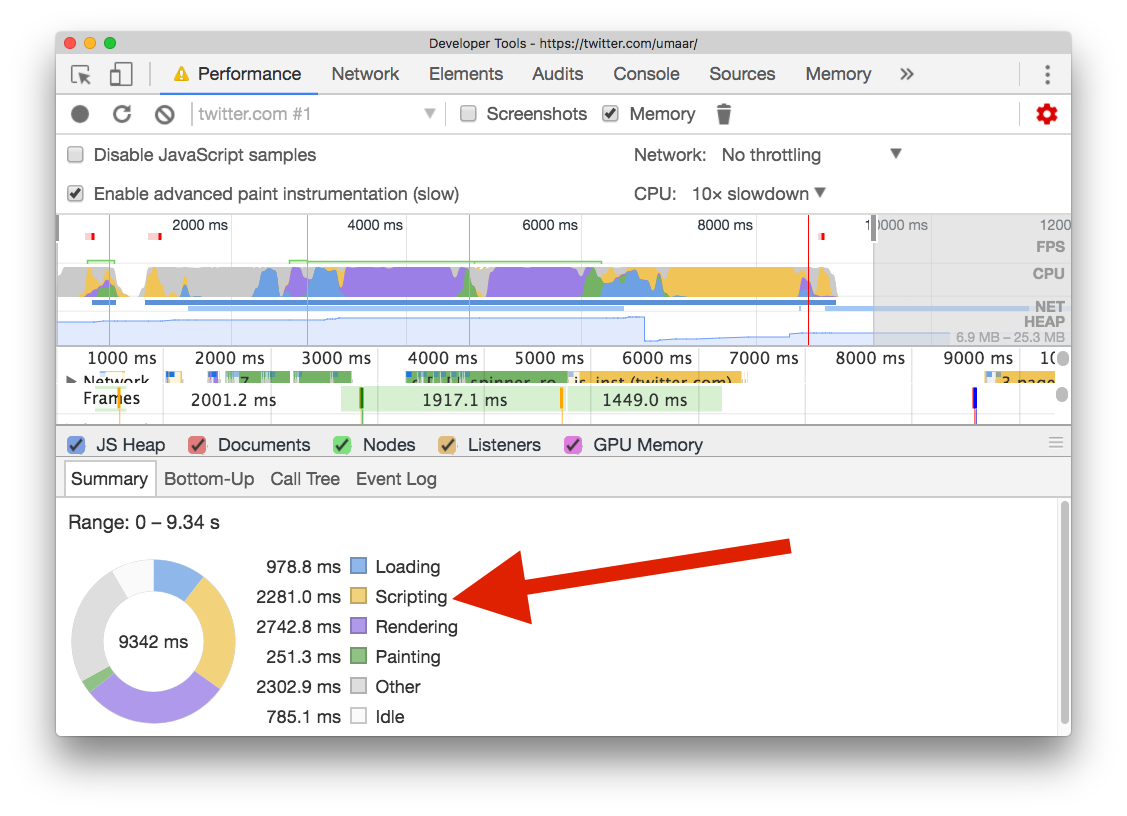
As an example, perform a Performance Panel recording on a JavaScript heavy website.
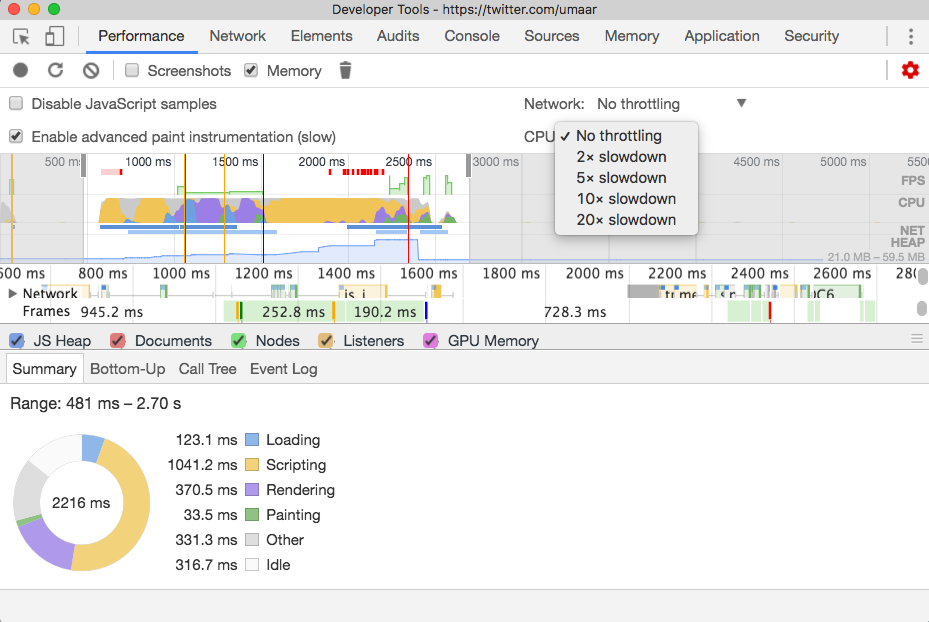
In a performance profile of Twitter (10x CPU throttling), notice there were over 2 seconds of script activity which would typically block the main thread. The Summary pane displays the total duration of script activity according to your recording.
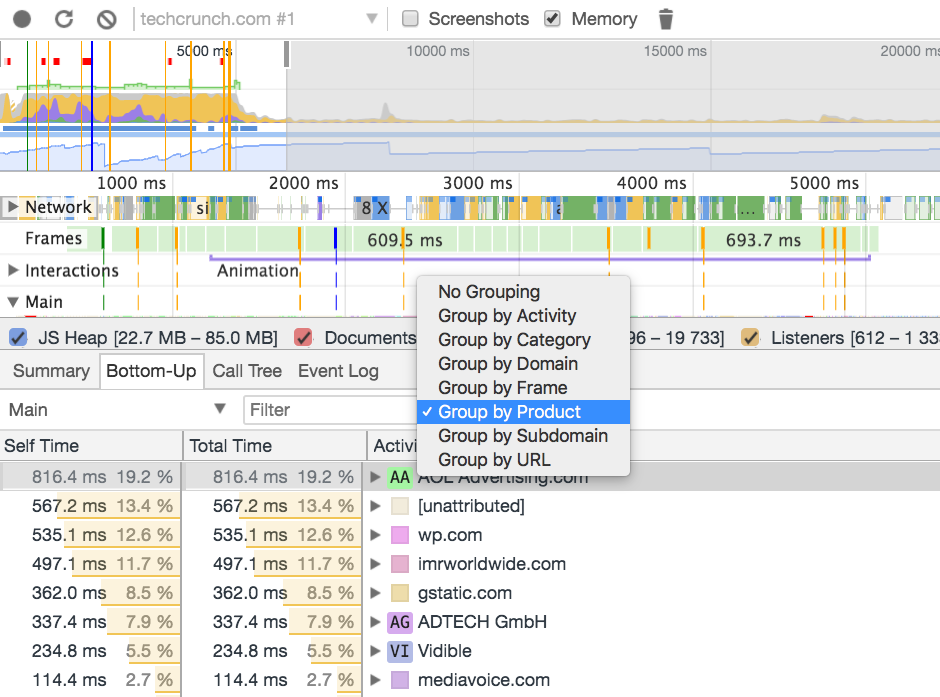
The Bottom-Up pane breaks down further the types of activity. You can use Product Grouping to understand which “Product” contributed which amount of activity.
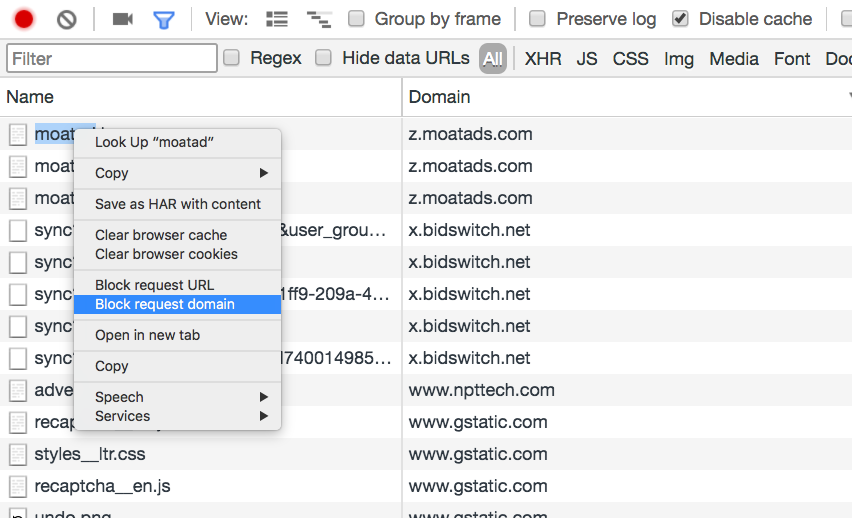
Request blocking
When you identify a culprit script, block the domain in the Network panel.
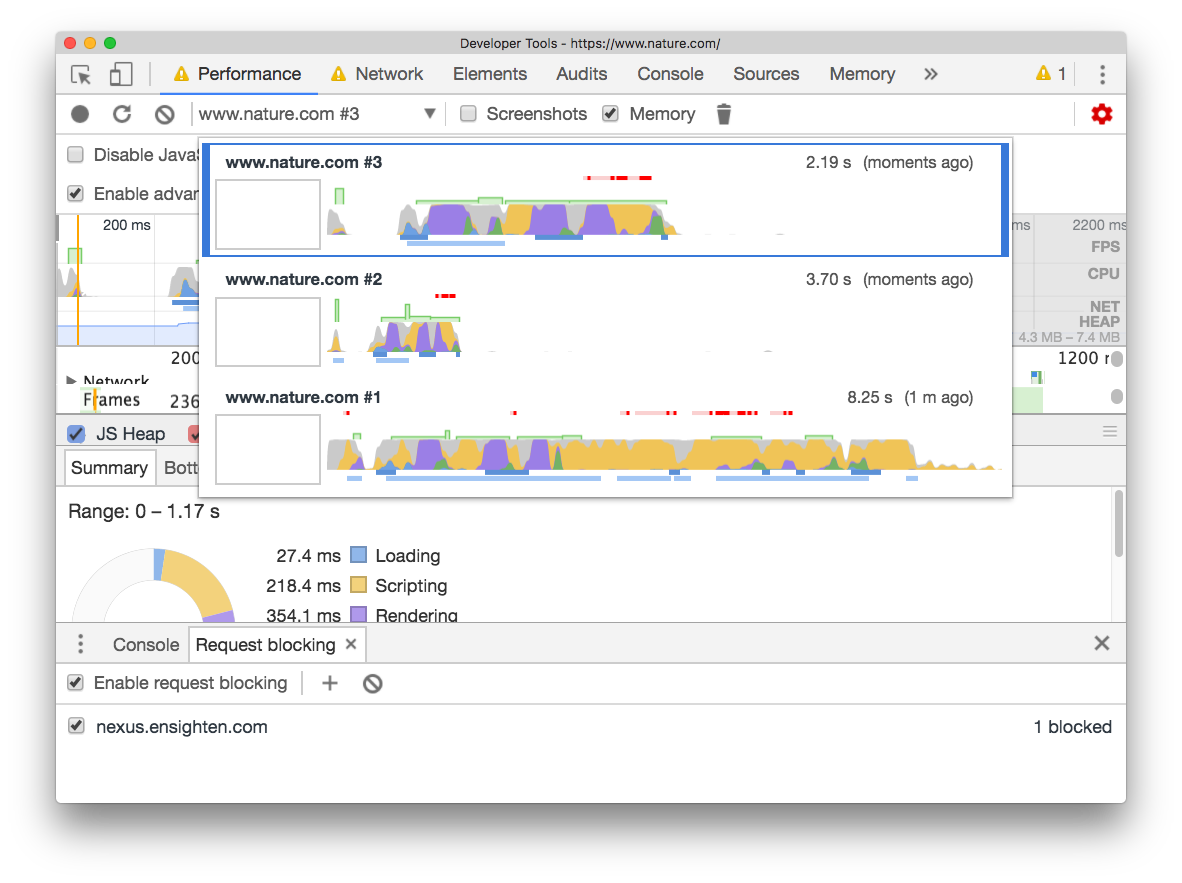
Timeline History
Now, record a new performance profile. In theory, the summary pane will show less script activity, since you have blocked a previously allowed domain from loading any resource.
You can also use the Timeline History feature to easily compare past recordings.
Conclusion
We saw a few features here:
- Performance Panel Summary Pane
- Bottom-up view
- CPU throttling
- Network request blocking
- Timeline history
We can combine these features to understand the real cost JavaScript resources can add onto a page.
8. JavaScript Debugging
Lesson Details
- Lesson: 8
- Description: Using various JavaScript debugging techniques in DevTools
The goal of this lesson
To solve a JavaScript bug in a ToDoMVC Vanilla JS app.
What we’ll cover
- Introduction
- Debugging from the outside in
- Call stack
- Conclusion
Introduction
This lesson focusses on an open source implementation of a To-do MVC app. A bug is introduced which results in the following behaviour.
- Add some to-do items to the to-do list.
- Remove, for example, the last item.
- Reload the page and observe the last item you removed reappears, and a different item is deleted.
Experience the bug!  The bug has been intentionally introduced into this fork which you can try out.
Debugging from the outside in
From your perspective, the code is brand new. The following techniques demonstrates how you can debug an app you are not familiar with.
To become more familiar with the JavaScript which handles To-do removals, set a DOM breakpoint on a parent element which has its children nodes modified.
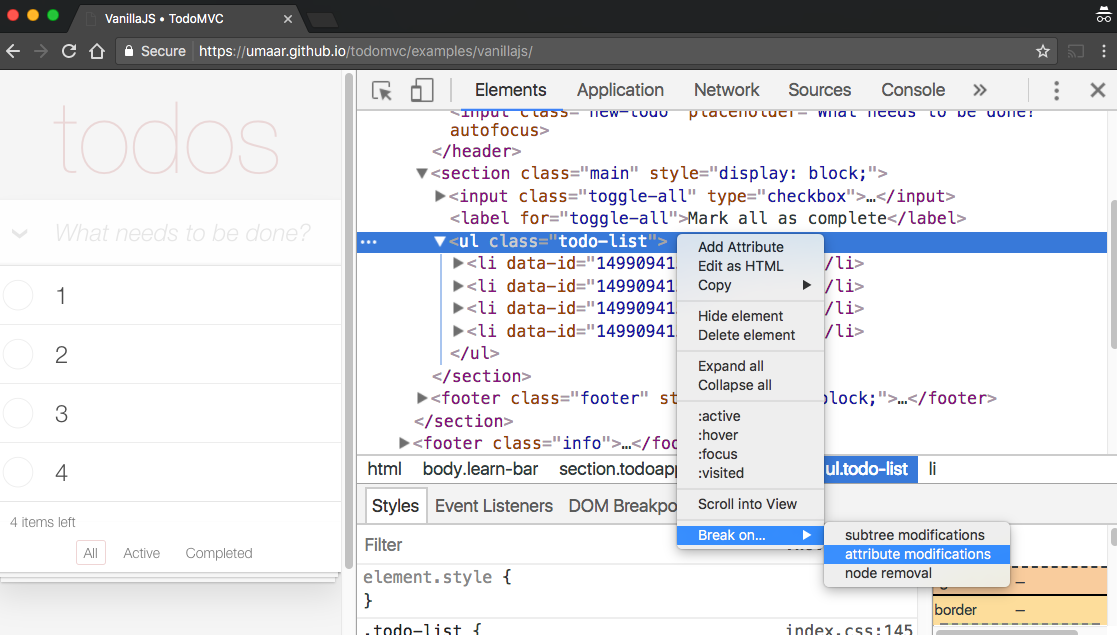
Trigger the DOM modification by removing an item. Observe you now pause at the line of JavaScript which causes the modification.
Call stack
Navigate your way through the call stack and discover each function call, one by one, which led to the final Node removal (the to-do item dissapearing from view)
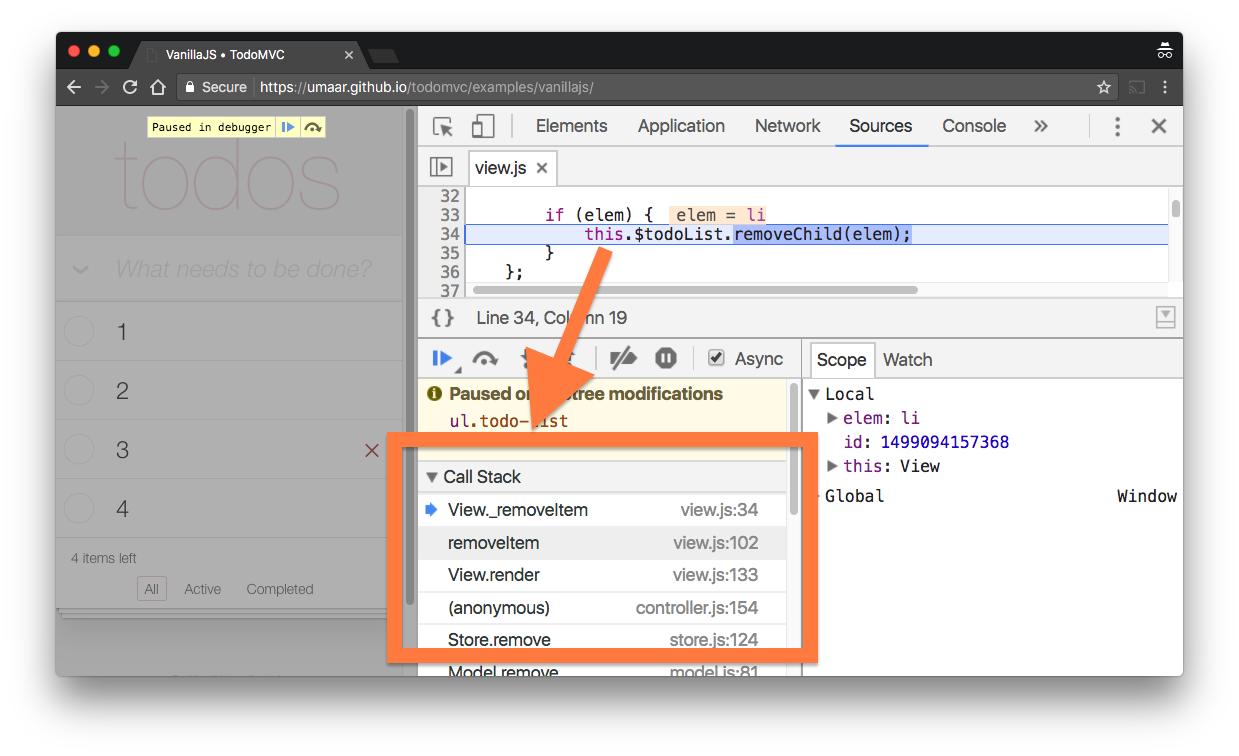
Take time to read the code. It is fair to make assumptions about what is happening at this point.
Notice that one particular call stack entry ( Store.remove ) contains a bit more logic than other functions. This is a good candidate for debugging.
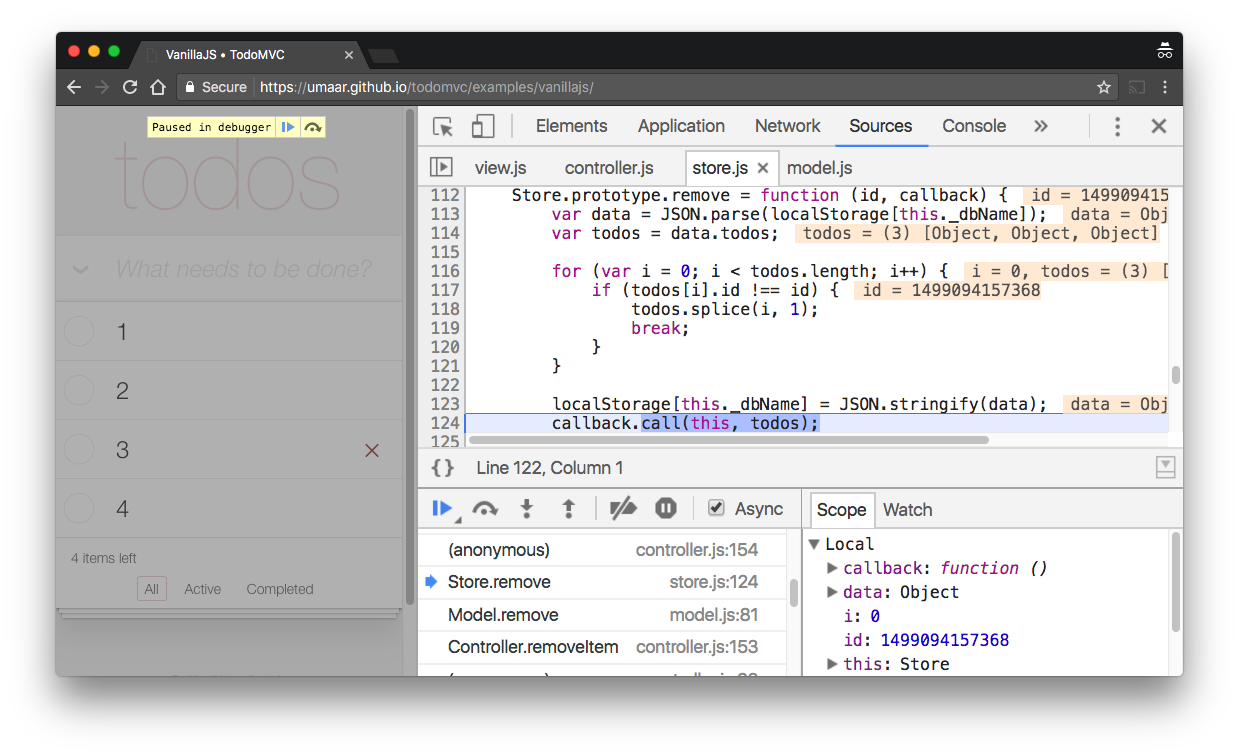
The bug is present in this method. When you find it, restart your “debugging session”. E.g.
- Reload the page.
- Set a new breakpoint on the line of code where you think the bug is. (hint: line 117 of store.js)
- Remove a todo item to pause on line 117 of store.js
While you are paused at a breakpoint, you can fix the bug. Change this code:
todos[i].id !== id
Into:
todos[i].id === id
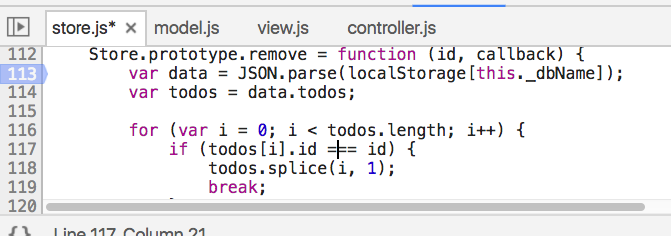
To reinject your changes into the JavaScript engine, hit Cmd + S / Ctrl + S / Right click > Save .
Now you can resume script execution and notice the to-do item is removed, but more importantly, when you reload the page, the removed to-do item does not reappear.
Conclusion
This lesson covers a few debugging tips.
- Set DOM breakpoints to debug from the outside in.
- Familiarise yourself with the JavaScript callstack and how it manifests in DevTools.
- Try out live-debugging of JavaScript code. Reminder: Pause at a breakpoint > Make code change > Save changes > Resume script execution.
9. JavaScript Profiling
Lesson Details
- Lesson: 9
- Description: Running a CPU profile on the backend of ModernDevTools.com
The goal of this lesson
Identify the cause of a performance issue in ModernDevTools.com
What we’ll cover
- Introduction
- Opening a client-side instance of DevTools for performance profiling
- Opening a Node.js instance of DevTools for performance profiling
- Running two CPU profiles
- Conclusion
Introduction
In this lesson, we will use this very website, ModernDevTools.com, to demonstrate backend performance profiling.
Each lesson contains course notes. The course notes for Lesson #1 load very quickly, around 20ms. However the course notes for a few others, like Lesson #3, take a lot longer, for example around 200ms.
The server-side Node.js code (the “backend”) is responsible for this. You can use DevTools with Node inspect to investigate further.
Opening a client-side instance of DevTools for performance profiling
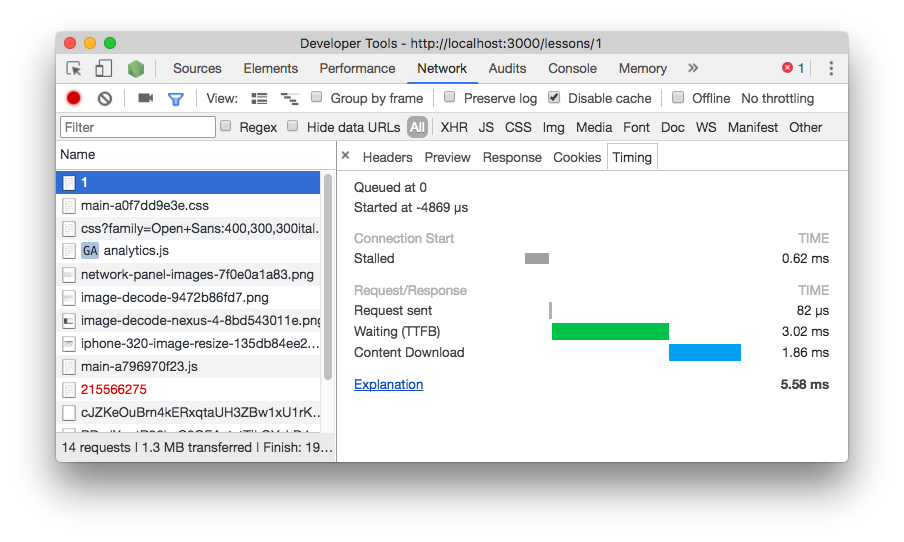
Record a Network profile of the course notes for lesson 1.
Now record a Network profile of the course notes for lesson 3.
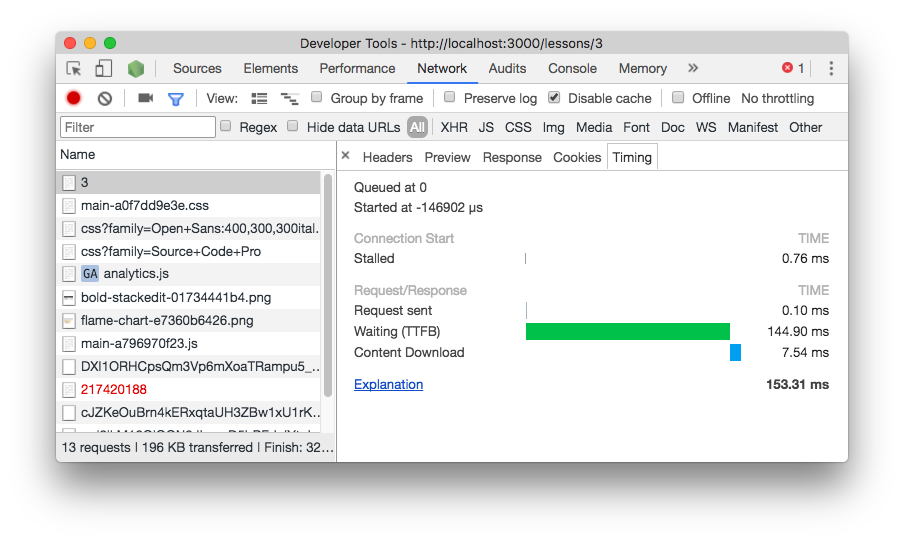
Notice the course notes for lesson 3 takes significantly longer respond than the course notes for lesson 1.
Opening a Node.js instance of DevTools for performance profiling
Run this in your terminal:
node --inspect entry-point.js
Now, navigate to: chrome://inspect/
And click ‘Inspect’ next to your Node.js instance.
Running two CPU profiles
You can run a performance profile on Node.js like this:
- Open a Node.js instance of DevTools.
- Navigate to the Profiler panel.
- Click ‘Start’.
- Perform the action you want to profile, this could be triggering a request-response action on your Node.js web server.
- Click ‘Stop’ in the Profiler panel.
- Observe and understand your JavaScript CPU profile.
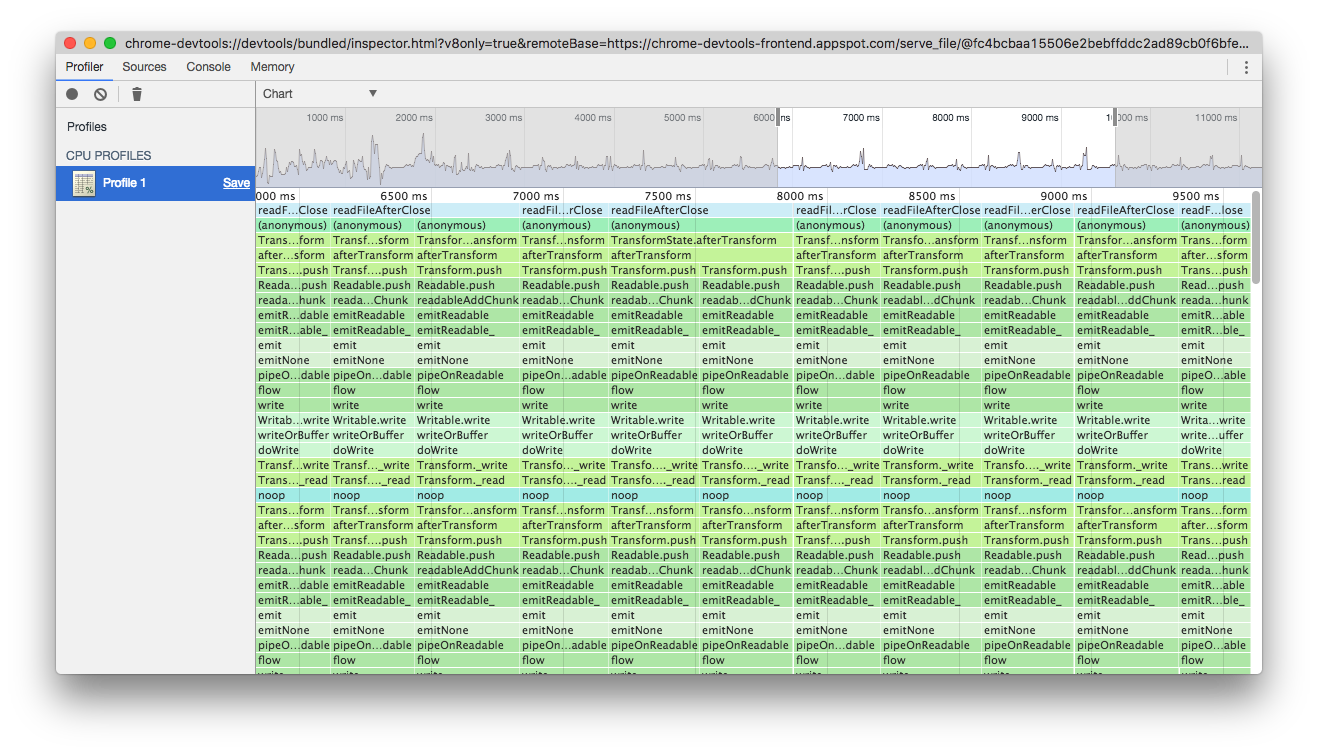
Here is the performance profile for the request of Lesson #1’s course notes.

Here is the performance profile for the request of Lesson #3’s course notes.
In the second performance profile of the slower lesson page, the bars on the graph are a lot wider. The width of a bar represents the time that operation took.
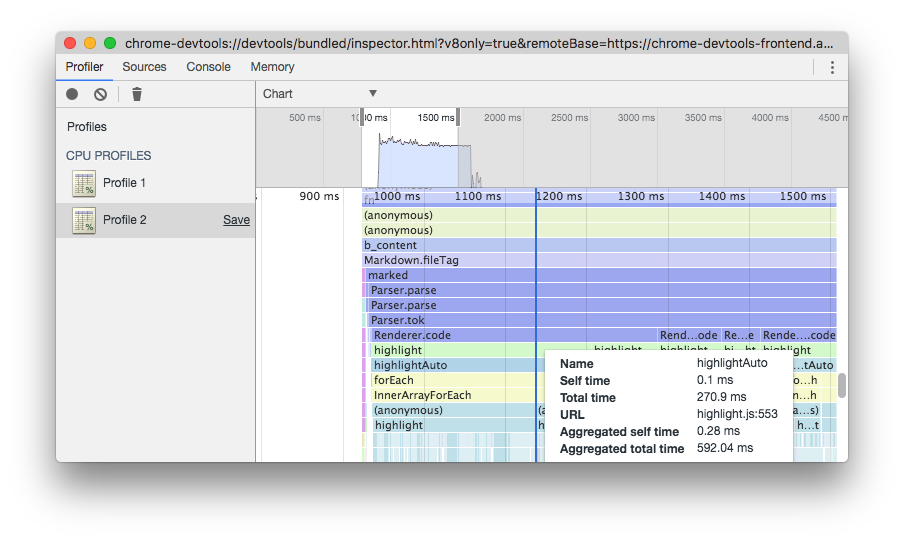
Looking at the graph, it is clear that highlight.js is the reason for the performance slow down. Here is what happens every time you, the user, reads the course notes:
- The Markdown parser on ModernDevTools.com parses the course notes for a particular lesson.
- The Markdown parser encounters code blocks. To get syntax highlighting working, it hands off this work to highlight.js.
- Highlight.js runs JavaScript heavy operations which takes time to do.
In this case, the performance slow down comes from this code in Node.js:
const marked = require('marked');
const highlightJS = require('highlight.js');

marked.setOptions({
    highlight(code) {
        return highlightJS.highlightAuto(code).value;
    }
});
Conclusion
What did we see?
Node.js took less time to deliver lesson #1 than it did for lesson #3. This is because for my very first lesson, I used plain HTML instead of markdown. For lesson 3 and most others, I used markdown and Highlight.js to do syntax highlighting.
A possible fix
To fix this: I could perform the syntax highlighting + markdown compilation steps at compile/build time rather than runtime . I could have a Gulp/Webpack/Bash script which converted all my markdown files into HTML files.
An exercise
Practice performing JavaScript CPU profiles on Node.js code. You could performance profile any of the following:
- A popular Node.js CLI module like trash.
- A Node.js webserver like express.
- A Node.js build tool like gulp.
10. JavaScript profiling: Gulp Edition (also applies to webpack)
Tip: Use a Chrome extension like Video Speed Controller to control the playback speed of videos.
Don’t forget to watch lesson 9, before watching lesson 10 (this lesson). This lesson follows on from the previous.
Lesson Details
- Lesson: 10
- Description: Running a CPU profile of a JavaScript linting task
The goal of this lesson
Understand why a Gulp (could also be webpack) linting task takes a long time to complete.
What we’ll cover
- Introduction
- Running a CPU profile
- Understanding the CPU profile
- Experimenting with a potential fix
- Conclusion
Introduction
I use Gulp as my JavaScript build tool. One of the tasks within my Gulpfile are related to linting of JavaScript resources. The plugin I use is xo (specifically gulp-xo).
Side note: You can read more about the benefits of XO in this playbook.
The Gulp task in question looks a little bit like this:
gulp.task('xo', () => {
    return gulp.src(['js/**/*.js']).pipe(xo());
});
XO, similarly to ESLint, scans each JavaScript file and ensures code consistency. The problem is, it takes a long time. Here is the terminal output:
➜  time ./node_modules/.bin/gulp xo
[22:29:48] Using gulpfile ~/Downloads/oscar/gulpfile.js
[22:29:48] Starting 'xo'...
[22:29:55] Finished 'xo' after 7.58 s
./node_modules/.bin/gulp xo  8.31s user 1.00s system 106% cpu 8.764 total
We can use JavaScript profiling to understand where the time is being spent.
Running a CPU profile
First, run this in your terminal:
node --inspect-brk ./node_modules/.bin/gulp xo
Then, navigate to chrome://inspect . Record a JavaScript CPU profile of the linting activity (instructions are in lesson 9).
Understanding the CPU profile
To progress, and explore potential performance bottlenecks, make some assumptions about what the wider blocks represent. To help, you can read the function name, and also click on the block to read the function definition. Spend some time doing this on various blocks.
Assume that each “column” in the flame chart represents one file linting .

Observe each block until you find a candidate for further exploring. Notice one block named getIgnore which is low down in the chart. Selecting a bar lower down in the chart helps get you closer to the root cause.
Click on the getIgnore block, notice you arrive at this function:
function getIgnores(opts) {
    ...
    const gitignores = globby.sync('**/.gitignore', {
        ignore: opts.ignores,
        cwd: opts.cwd || process.cwd()
    });
    ...
}
This function appears to recursively scan for .gitignore files to understand which files it does not need to lint. This assumption aligns well with the naming of the function.
Experimenting with a potential fix
Use Live-edit to confirm '**/.gitignore' is the slow part. Set a breakpoint at the top of the getIgnores function (the first line within the body of the function) and then restart your debugging session. On your next debugging session, you do not need to run a CPU profile. Rather, “Resume Script Execution” after you are paused at the first breakpoint, and then, live-edit the getIgnores function to time it.

Make the changes shown in the image and notice the console output. This function call now executes in milliseconds, rather than hundreds of milliseconds.
Notice, this does change existing functionality, however the goal of this lesson was to understand the root cause of the performance slowdown.
Conclusion
The performance issue was because of this combination:
-
.gitignorefile searches being done recursively - Having many subdirectories in my particular project (meaning the
getIgnoreshad more work to do)
Use JavaScript CPU profiling to profile Node.js code. You can use it to identify performance issues in:
- Server side code
- Build task runners like Gulp/Grunt/Webpack
- JavaScript code which runs on a raspberry pi
And more.
You can live edit JavaScript code while paused at a breakpoint to wrap a certain function call like this:
function someFunction() {
    // <-- Paused at a breakpoint here
    console.time('Some Label');
    // Expensive operations here
    console.timeEnd('Some Label');
}
11. A YouTube performance issue
Lesson Details
- Lesson: 11
- Description: Running a performance profile on the YouTube.com search box
The goal of this lesson
To understand the cause of a performance issue on YouTube.com.
What we’ll cover
- Introduction
- Reminder: How to perform a performance profile
- Looking at The performance profile
- Conclusion
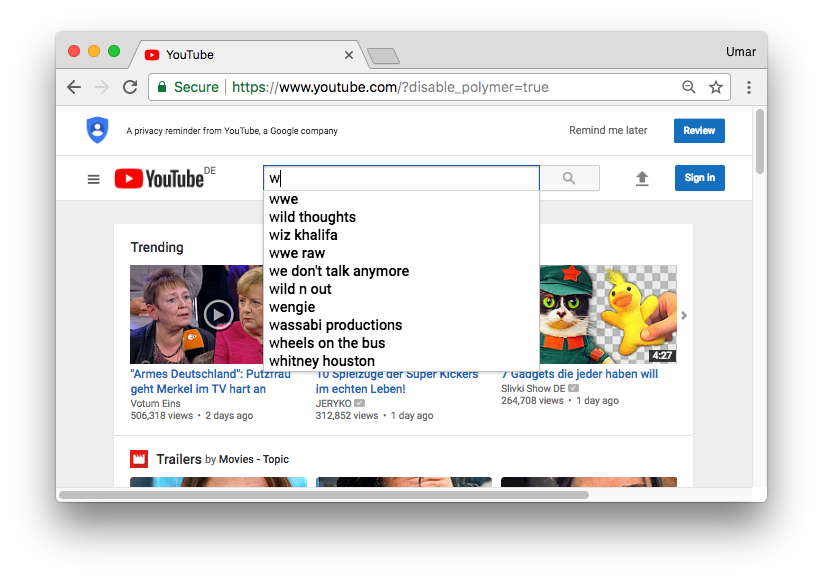
Introduction
On YouTube.com there is a search box at the top of the page. When you start typing, you trigger autosuggest. Let’s profile this.
Reminder: How to perform a performance profile
As a reminder, here are the steps to follow when investigating front-end performance issues.
- Identify the action which might be a bottleneck. E.g. scrolling the page, opening a drop down menu, resizing the browser etc. In this example, it is triggering the dropdown search on YouTube.
- Start a recording from the performance panel (ideally with CPU throttling turned on).
- Trigger the action identified in step #1.
- Stop the recording.
- Analyse the results.
Looking at The performance profile
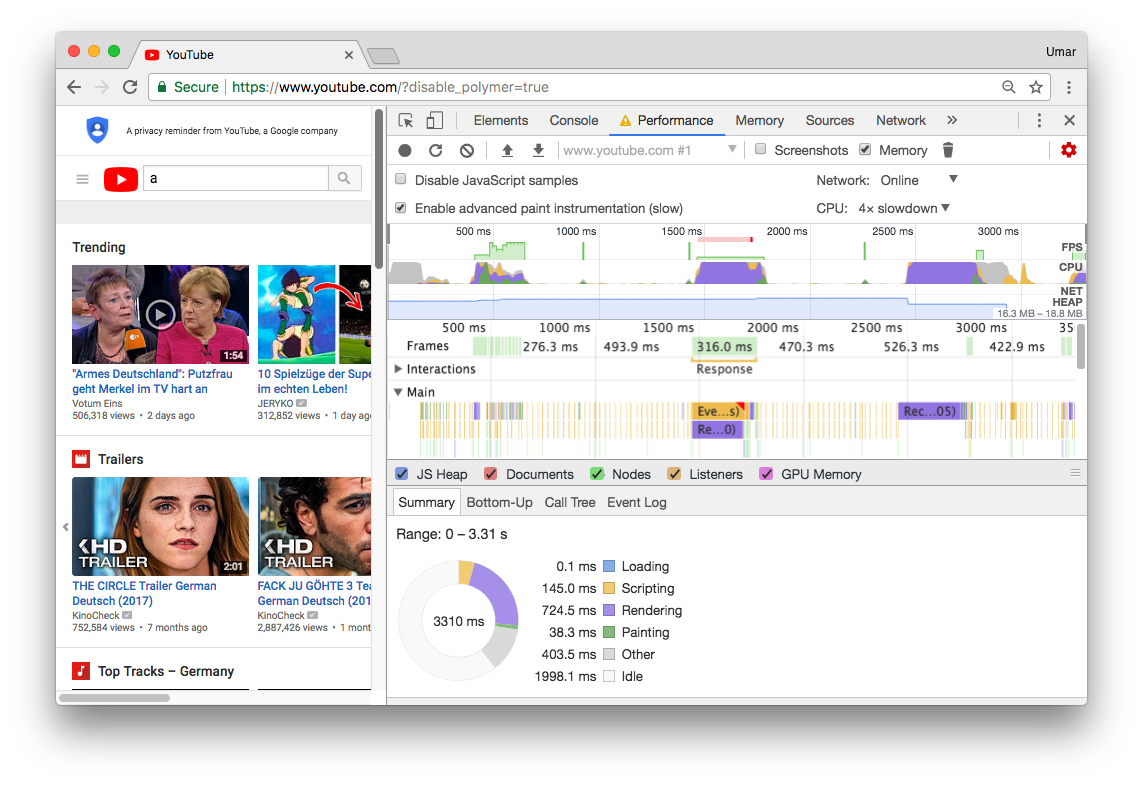
Here is the performance profile of activating the search dropdown.
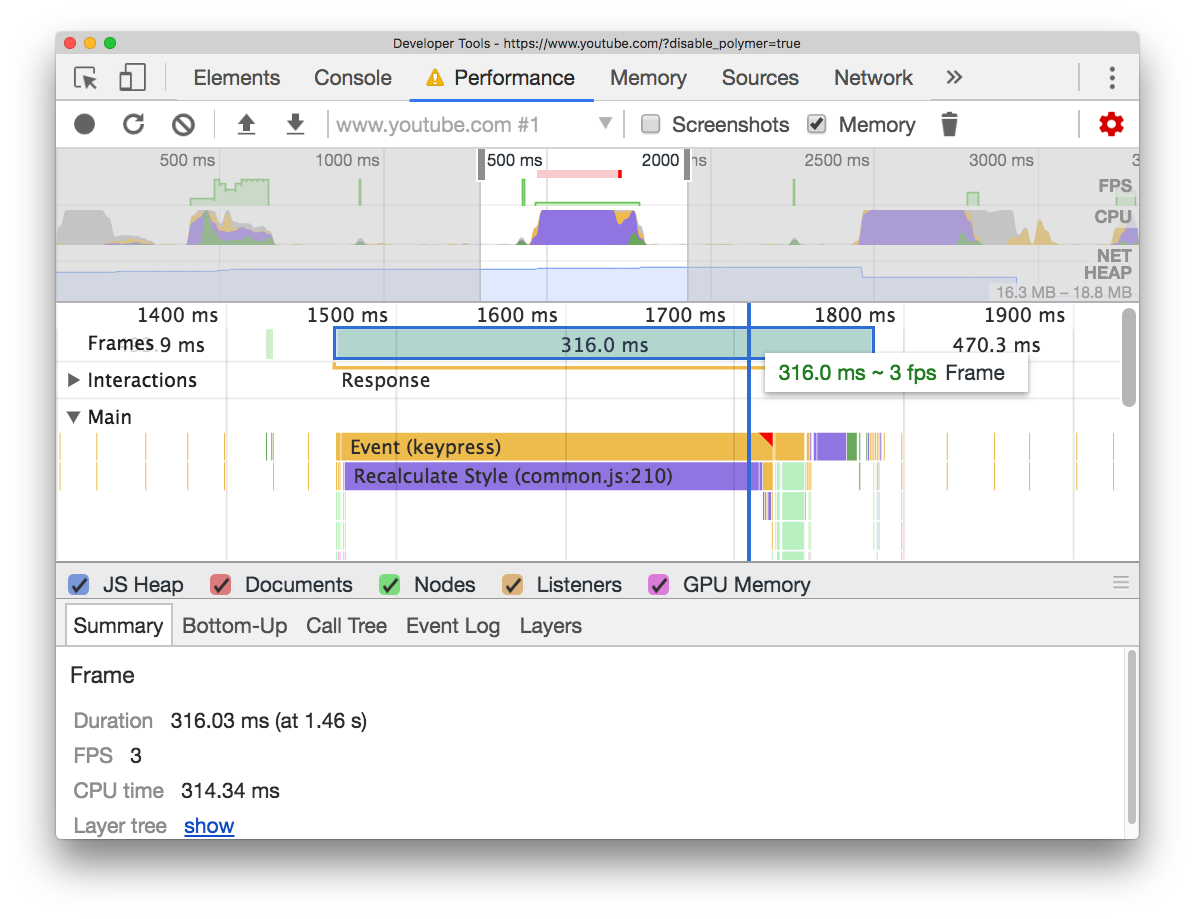
Zoom into one of the large “blocks” or “peaks”.
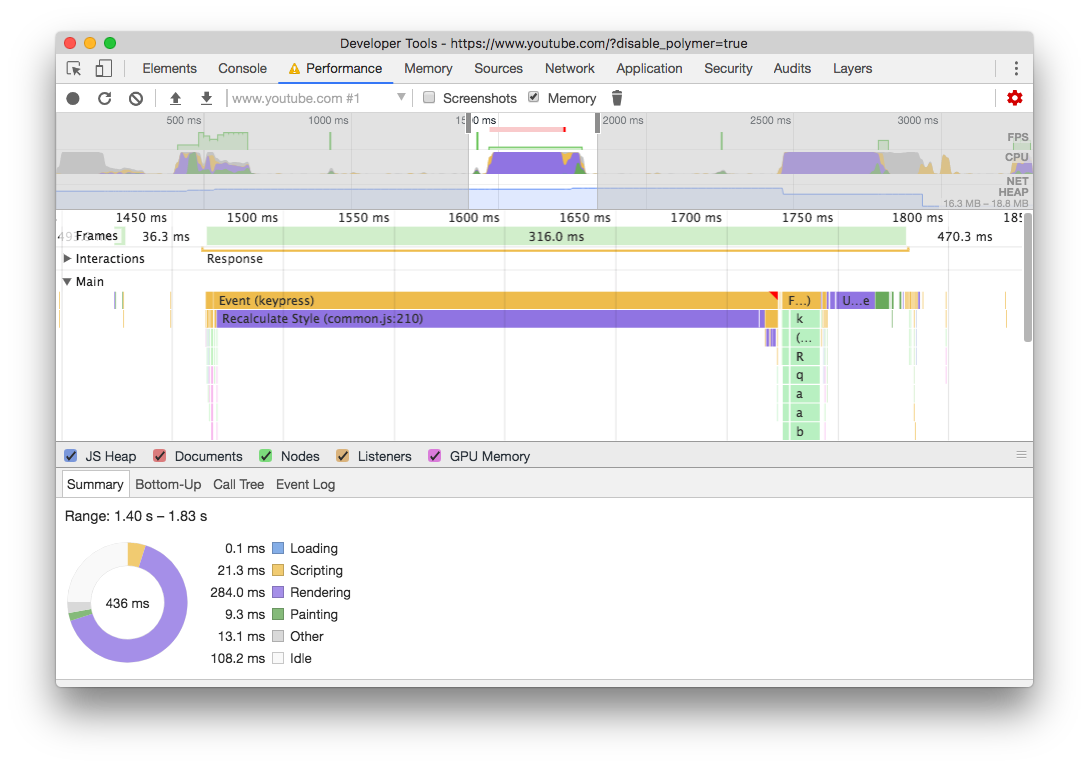
We can confirm this period of time was slow, the frame took 316 ms to execute, and ran at 3 FPS (1000 ms / 316 ms).
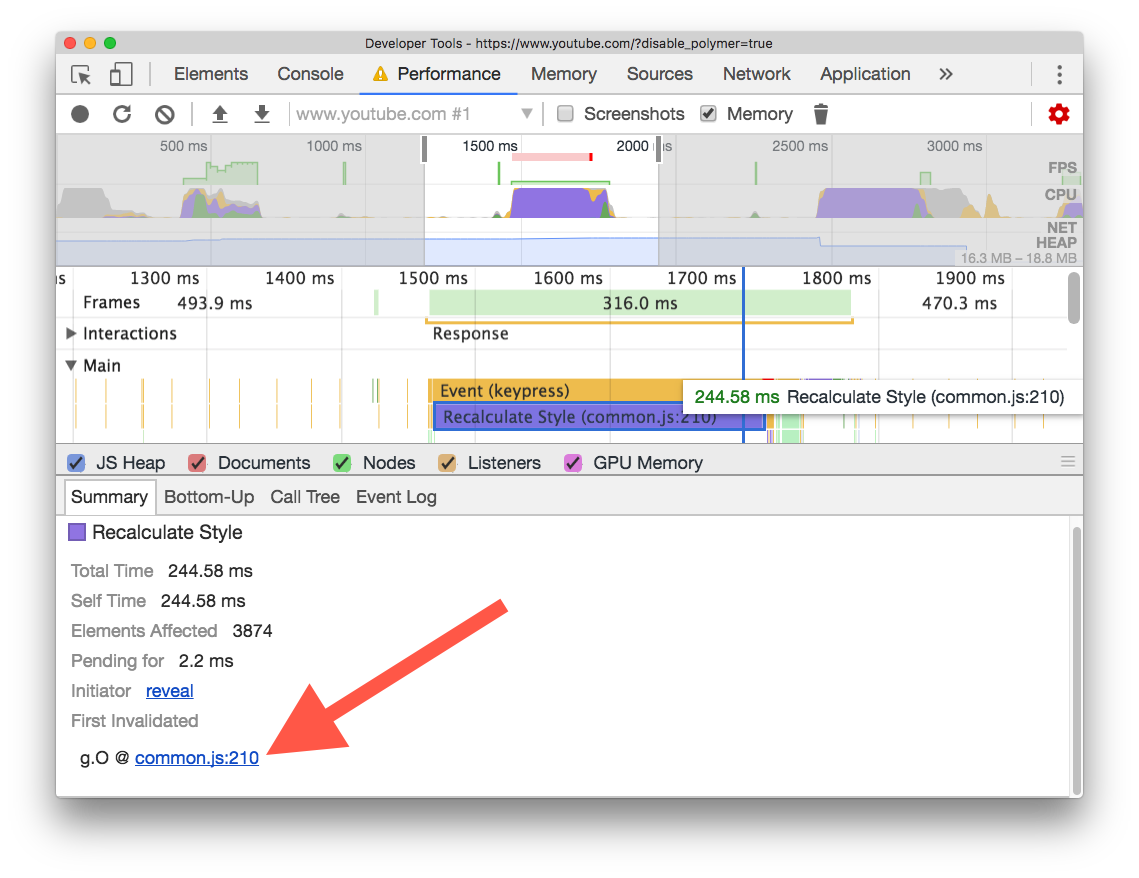
If you click on one of the slow ‘events’ which occurred (Recalculate Style), DevTools is able to display the code responsible for this slow event. The link is present in the summary pane, click on it.
DevTools takes you to exact point in code which triggered the event. As the code is minified, you should pretty print it.
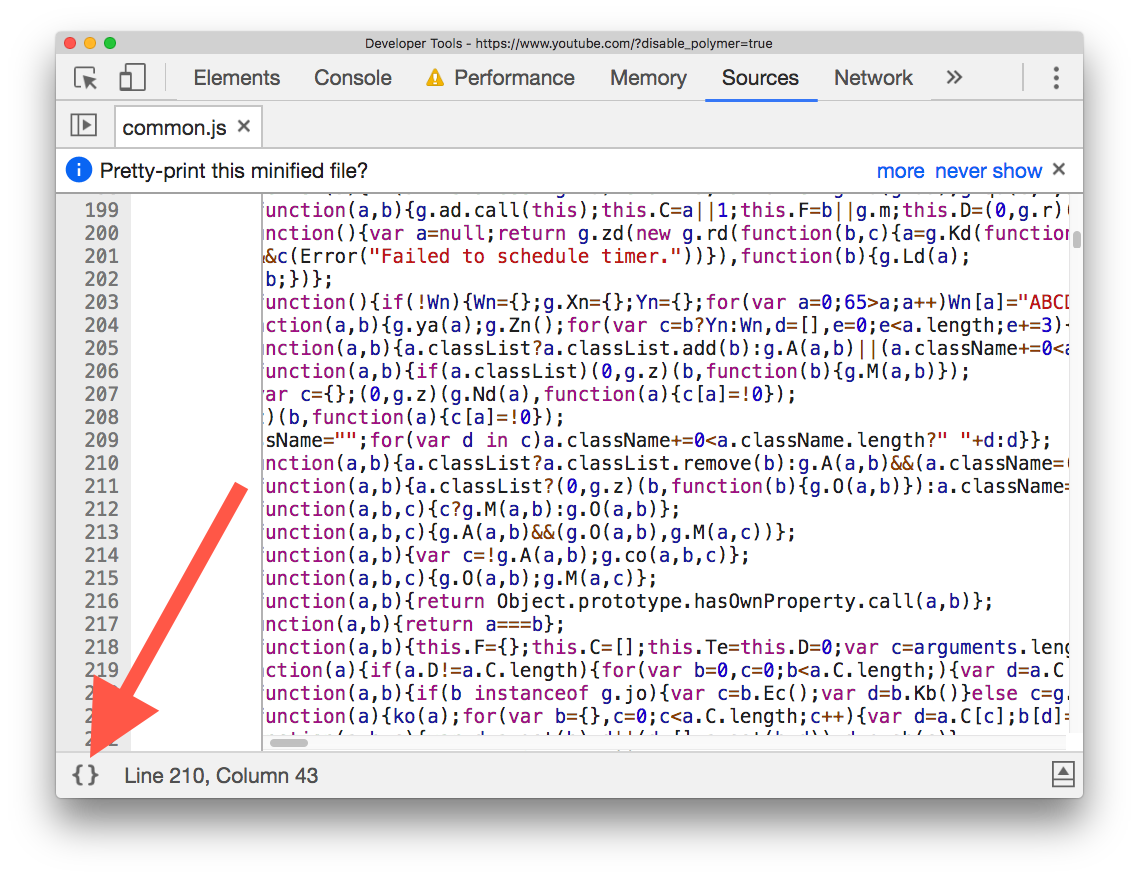
From here, the process is not always scientific. You should use your experience & common sense to figure out what could be causing the performance bottleneck.

In this case, we see the responsible line of JavaScript code is:
a.classList ? a.classList.remove(b) : g.A(a, b) && (a.className = (0))
One thing which stands out is: CSS classes are being modified on an element.
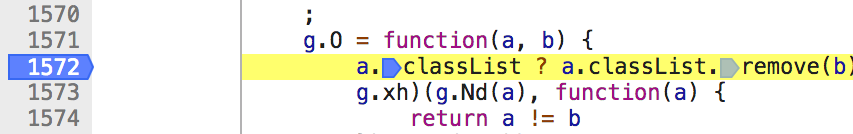
Set a breakpoint on the relevant line of code. When this portion of code executes: a.classList.remove(b) , we need to understand what variables a and b are exactly.
Trigger the action on the YouTube homepage again, this cases the breakpoint to trigger. When paused at a breakpoint, DevTools automatically detects variables a and b as variables of interest. Because of this, the variables are revealed in the scope pane.
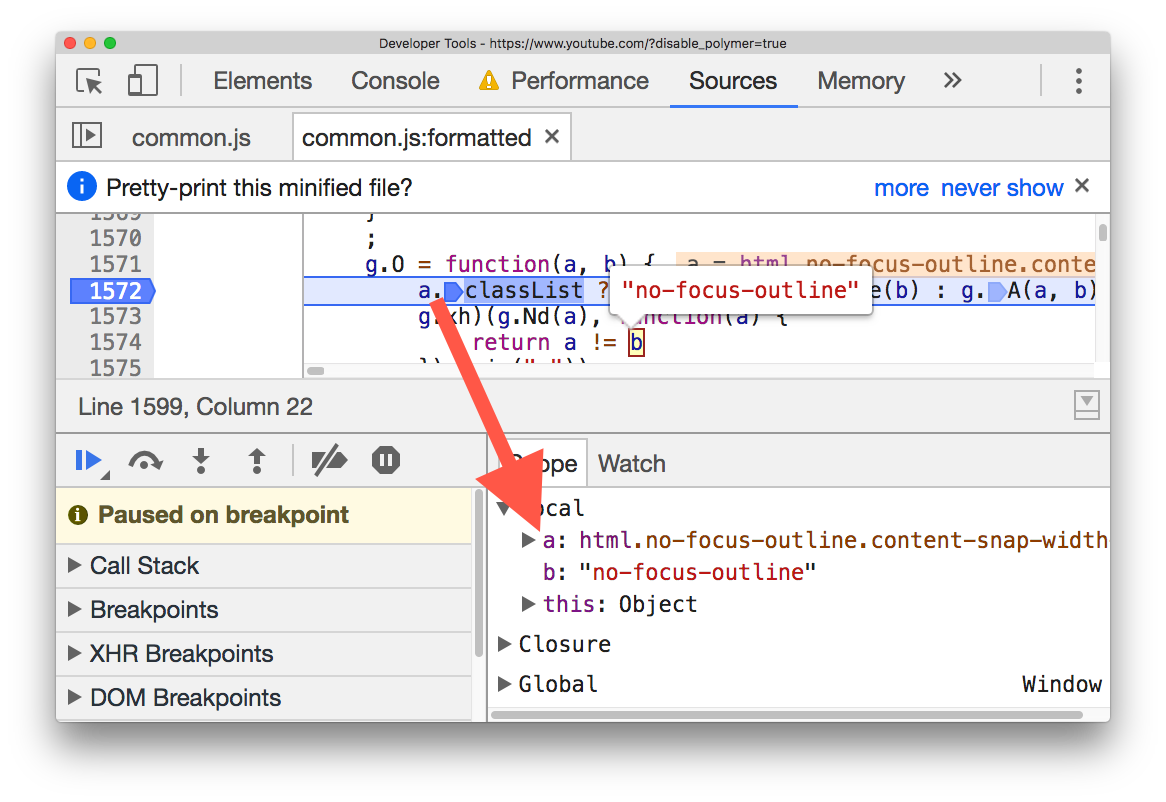
At this point, it should be clear that: variable a is the HTML element in the document, and variable b is the classname 'no-focus-outline' which is applied/removed.
When the search dropdown is triggered, a class of 'no-focus-outline' is removed from the HTML element.
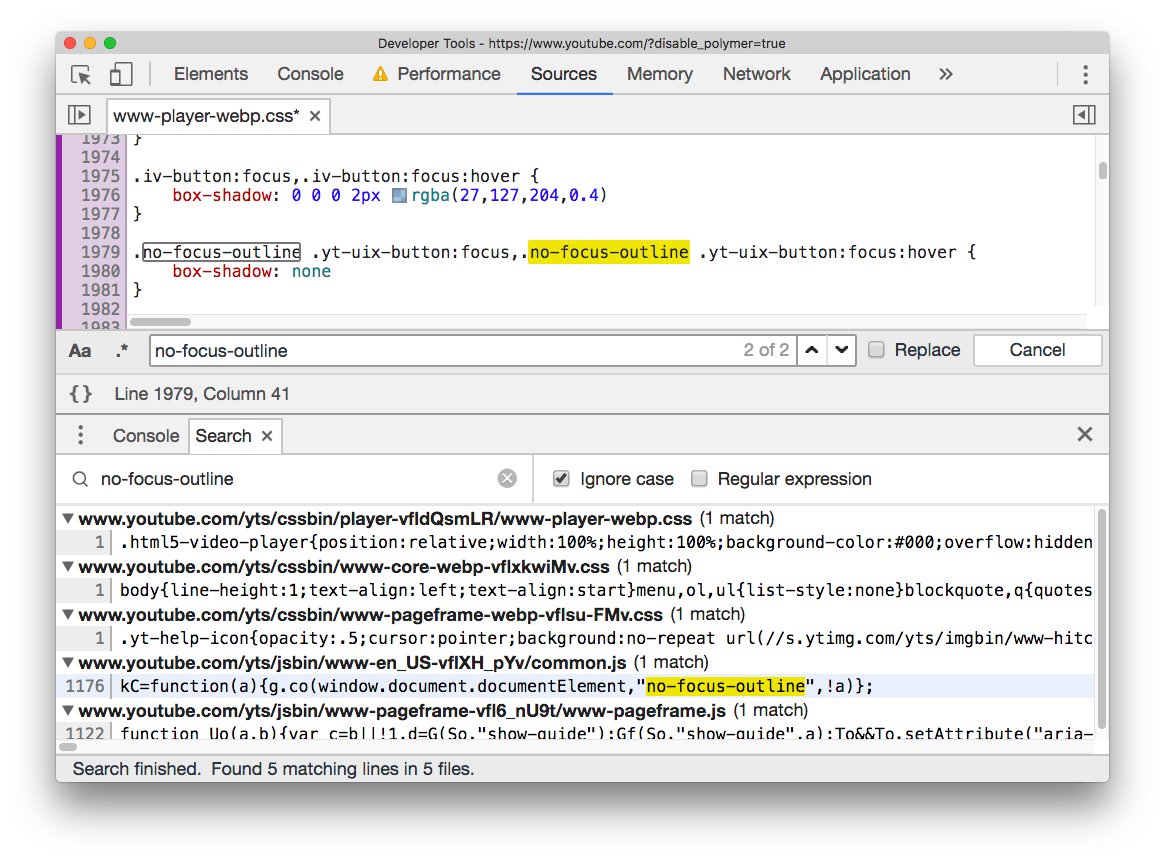
We can perform a project wide code search (Cmd + Alt + f) from the Sources Panel to understand in what ways a class of no-focus-outline affects the page.
Conclusion
The performance summary pane you saw at the start may start to make sense.
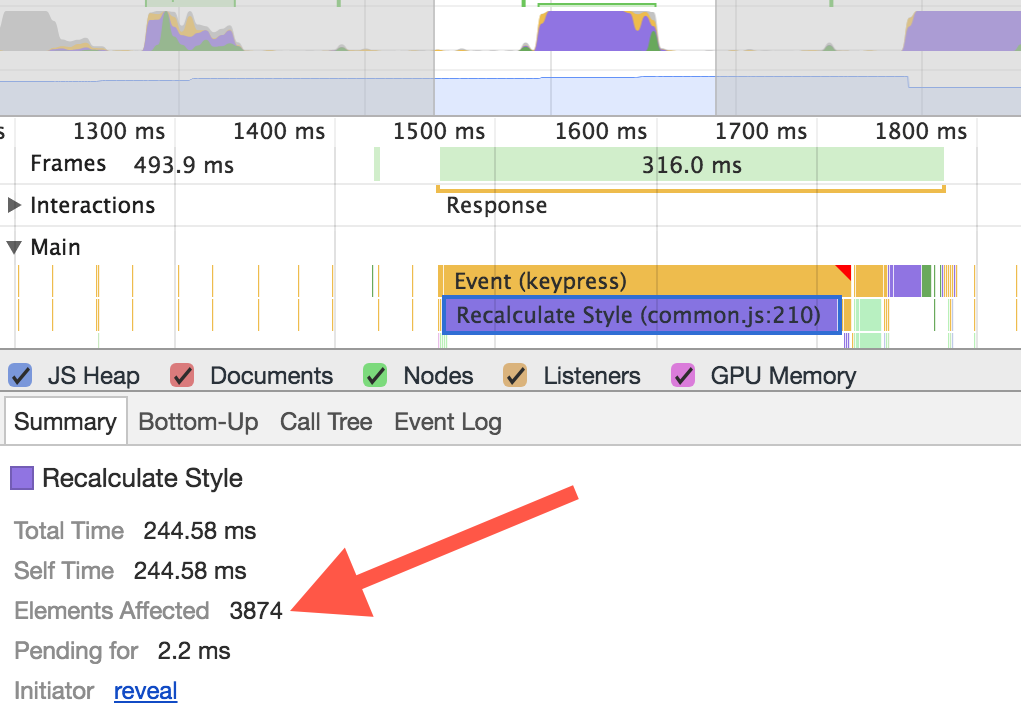
By changing the class name of an element very high up in the DOM, it has the potential to affect a large number of elements. In this case:
- The class change is on the topmost element, the HTML element.
- It affects 3874 child nodes.
- Recalculate style is triggered, this lasts for 244.58 ms.
Potential workarounds:
- Find a new shared common parent of the child nodes which has a shorter distance than the HTML element.
- It could be preferable to target the elements which need their styles changed in JavaScript directly. This could decrease maintainability however.