s03e20 - The idea behind blackbox components
Quickly integrate any D3 code in your React project with Blackbox Components
Blackbox components are the quickest way to integrate D3 and React. You can think of them as wrappers around D3 visualizations.
With the blackbox approach, you can take any D3 example from the internets or your brain, wrap it in a React component, and it Just Works™. This is great when you’re in a hurry, but comes with a big caveat: You’re letting D3 control some of the DOM.
D3 controlling the DOM is okay , but it means React can’t help you there. That’s why it’s called a Blackbox – React can’t see inside.
No render engine, no tree diffing, no dev tools to inspect what’s going. Just a blob of DOM elements.
Okay for small components or when you’re prototyping, but I’ve had people come to my workshops and say “We built our whole app with the blackbox approach. It takes a few seconds to re-render when you click something. Please help”

Here’s how it works:
- React renders an anchor element
- D3 hijacks it and puts stuff in
You manually re-render on props and state changes. Throwing away and rebuilding the entire DOM subtree on each render. With complex visualizations this becomes a huge hit on performance.
Use this technique sparingly.
s03e21 - A quick blackbox example - a D3 axis
A quick blackbox example - a D3 axis
Let’s build an axis component. Axes are the perfect use-case for blackbox components. D3 comes with an axis generator bundled inside, and they’re difficult to build from scratch.
They don’t look difficult, but there are many tiny details you have to get just right .
D3’s axis generator takes a scale and some configuration to render an axis for us. The code looks like this:
const scale = d3.scaleLinear()
    .domain([0, 10])
    .range([0, 200]);
const axis = d3.axisBottom(scale);

d3.select('svg')
  .append('g')
  .attr('transform', 'translate(10, 30)')
  .call(axis);
You can try it out on CodeSandbox.
If this code doesn’t make any sense, don’t worry. There’s a bunch of D3 to learn, and I’ll help you out. If it’s obvious, you’re a pro! This book will be much quicker to read.
We start with a linear scale that has a domain [0, 10] and a range [0, 200] . Scales are like mathematical functions that map a domain to a range. In this case, calling scale(0) returns 0 , scale(5) returns 100 , scale(10) returns 200 . Just like a linear function from math class – y = kx + n.
We create an axis generator with axisBottom , which takes a scale and creates a bottom oriented axis – numbers below the line. You can also change settings for the number of ticks, their sizing, spacing, and so on.
Equipped with an axis generator, we select the svg element, append a grouping element, use a transform attribute to move it 10 px to the right and 30 px down, and invoke the generator with .call() .
It creates a small axis:
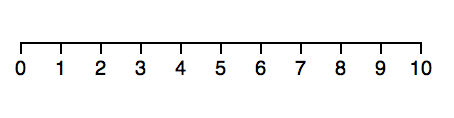
Simple axis
Play around with it on Codesandbox. Change the scale type, play with axis orientation. Use .ticks on the axis to change how many show up. Have some fun 
s03e22 - A React + D3 axis
A quick blackbox example - a React+D3 axis
Now let’s say we want to use that same axis code but as a React component. The simplest way is to use a blackbox component approach like this:
class Axis extends Component {
  gRef = React.createRef();

  componentDidMount() { this.d3render() }
  componentDidUpdate() { this.d3render() }

  d3render() {
    const scale = d3.scaleLinear()
                    .domain([0, 10])
                    .range([0, 200]);
      const axis = d3.axisBottom(scale);

    d3.select(this.gRef)
      .call(axis);
  }

  render() {
      return <g transform="translate(10, 30)" ref={this.gRef} />
  }
}
So much code! Worth it for the other benefits of using React in your dataviz. You’ll see
We created an Axis component that extends React’s base Component class. We can’t use functional components because we need lifecycle hooks.
Our component has a render method. It returns a grouping element ( g ) moved 10px to the right and 30px down using the transform attribute. Same as before.
A React ref saved in this.gRef and passed into our <g> element with ref lets us talk to the DOM node directly. We need this to hand over rendering control to D3.
The d3render method looks familiar. It’s the same code we used in the vanilla D3 example. Scale, axis, select, call. Only difference is that instead of selecting svg and appending a g element, we select the g element rendered by React and use that.
We use componentDidUpdate and componentDidMount to keep our render up to date. Ensures that our axis re-renders every time React’s engine decides to render our component.
That wasn’t so bad, was it?
You can make the axis more useful by getting positioning, scale, and orientation from props. We’ll do that in our big project.
Practical exercise
Try implementing those as an exercise. Make the axis more reusable with some carefully placed props.
Here’s my solution, if you get stuck  https://codesandbox.io/s/5ywlj6jn4l
s03e23 - A D3 blackbox higher order component - HOC
A D3 blackbox higher order component – HOC
After that example you might think this is hella tedious to implement every time. You’d be right!
Good thing you can abstract it all away with a higher order component – a HOC. Now this is something I should open source (just do it already), but I want to show you how it works so you can learn about the HOC pattern.
Higher order components are great when you see multiple React components sharing similar code. In our case, that shared code is:
- rendering an anchor element
- calling D3’s render on updates
With a HOC, we can abstract that away into a sort of object factory. It’s an old concept making a comeback now that JavaScript has classes.
Think of our HOC as a function that takes some params and creates a class – a React component. Another way to think about HOCs is that they’re React components wrapping other React components and a function that makes it easy.
A HOC for D3 blackbox integration, called D3blackbox , looks like like this:
function D3blackbox(D3render) {
  return class Blackbox extends React.Component {
    anchor = React.createRef();

    componentDidMount() { D3render.call(this); }
    componentDidUpdate() { D3render.call(this) }

    render() {
      const { x, y } = this.props;
      return <g transform={`translate(${x}, ${y})`} ref={this.anchor} />;
    }
  }
}
You’ll recognize most of that code from earlier.
We have componentDidMount and componentDidUpdate lifecycle hooks that call D3render on component updates. render renders a grouping element as an anchor with a ref so D3 can use it to render stuff into.
Because D3render is no longer a part of our component, we have to use .call to give it the scope we want: this class, or rather this instance of the Blackbox class.
We’ve also made some changes that make render more flexible. Instead of hardcoding the translate() transformation, we take x and y props. { x, y } = this.props takes x and y out of this.props using object decomposition, and we used ES6 string templates for the transform attribute.
Consult the ES6 cheatsheet for details on the syntax.
Using our new D3blackbox HOC to make an axis looks like this:
const Axis = D3blackbox(function () {
    const scale = d3.scaleLinear()
              .domain([0, 10])
              .range([0, 200]);
    const axis = d3.axisBottom(scale);

    d3.select(this.anchor)
      .call(axis);
});
You know this code! We copy pasted our axis rendering code from before, wrapped it in a function, and passed it into D3blackbox . Now it’s a React component.
Play with this example on Codesandbox, here.
s03e24 - D3blackbox magic trick - render anything in 30 seconds
D3blackbox magic trick – render anything in 30 seconds
Let me show you a magic trick. 30 seconds to take a random D3 piece of code and add it to your React project.
We can try it on the example barchart from before.
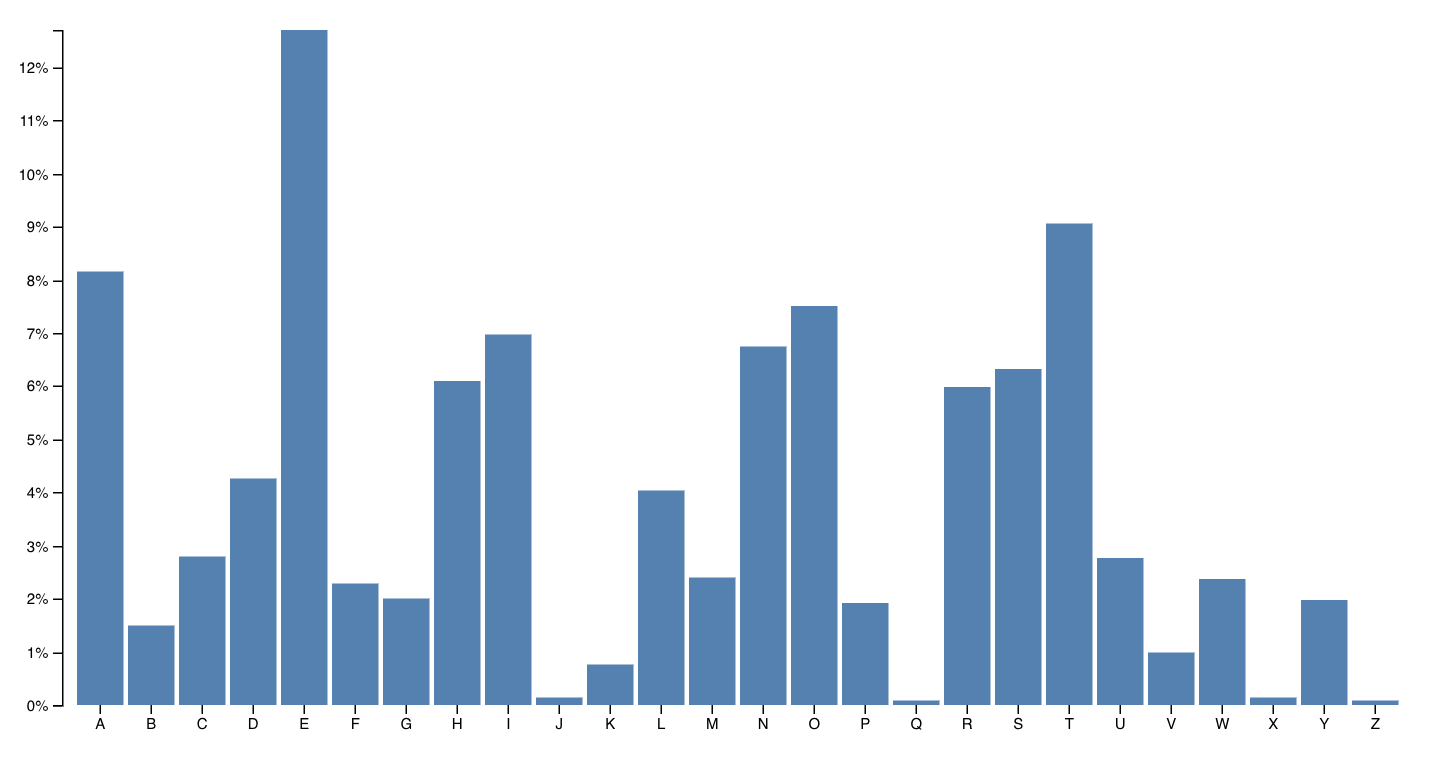
An example D3 barchart
You can try it online. When you hover on a bar, it changes color. Pretty neat.
I recommend you follow along in a CodeSandbox. If you fork the react-d3-axis-hoc CodeSandbox that will be easiest.
You should already have the D3blackbox HOC. If you don’t, make a new file and paste it in.
With your HOC ready, create a new file in CodeSandbox. Call it Barchart.js .
Add your imports:
import React from 'react';
import D3blackbox from './D3blackbox';
import * as d3 from 'd3';
This gives you React, our HOC, and D3.
Now right-click view code on that barchart and copy the code. Wrap it in a D3blackbox call. Like this:
const Barchart = D3blackbox(function () {
  var svg = d3.select("svg"),
      margin = {top: 20, right: 20, bottom: 30, left: 40},
      width = +svg.attr("width") - margin.left - margin.right,
      height = +svg.attr("height") - margin.top - margin.bottom;

  var x = d3.scaleBand().rangeRound([0, width]).padding(0.1),
      y = d3.scaleLinear().rangeRound([height, 0]);

  var g = svg.append("g")
      .attr("transform", "translate(" + margin.left + "," + margin.top + "😉");

  d3.tsv("data.tsv", function(d) {
    d.frequency = +d.frequency;
    return d;
  }, function(error, data) {
    if (error) throw error;

    x.domain(data.map(function(d) { return d.letter; }));
    y.domain([0, d3.max(data, function(d) { return d.frequency; })]);

    g.append("g")
        .attr("class", "axis axis--x")
        .attr("transform", "translate(0," + height + "😉")
        .call(d3.axisBottom(x));

    g.append("g")
        .attr("class", "axis axis--y")
        .call(d3.axisLeft(y).ticks(10, "%"))
      .append("text")
        .attr("transform", "rotate(-90)")
        .attr("y", 6)
        .attr("dy", "0.71em")
        .attr("text-anchor", "end")
        .text("Frequency");

    g.selectAll(".bar")
      .data(data)
      .enter().append("rect")
        .attr("class", "bar")
        .attr("x", function(d) { return x(d.letter); })
        .attr("y", function(d) { return y(d.frequency); })
        .attr("width", x.bandwidth())
        .attr("height", function(d) { return height - y(d.frequency); });
  });
})

export default Barchart;
That should throw some errors. We have to change the d3.select and get width and height from props.
const Barchart = D3blackbox(function () {
  // Delete the line(s) between here...
  var svg = d3.select("svg"),
  // ...and here.
  // Insert the line(s) between here...
  var svg = d3.select(this.anchor.current)
  // ...and here.
      margin = {top: 20, right: 20, bottom: 30, left: 40},
      // Delete the line(s) between here...
      width = +svg.attr("width") - margin.left - margin.right,
      height = +svg.attr("height") - margin.top - margin.bottom;
      // ...and here.
      // Insert the line(s) between here...
      width = +this.props.width - margin.left - margin.right,
      height = +this.props.height - margin.top - margin.bottom;
      // ...and here.
Most D3 examples use a global svg variable to refer to their drawing area – the SVG. Change that to the element you want, your anchor, and the whole visualization should render in there.
We also replaced reading width and height from the SVG element to getting them from props. This makes our component more reusable and better follows best practices.
Next step is to change where our barchart gets its data. Gotta use the public URL.
//Delete the line(s) between here...
d3.tsv("data.tsv", function(d) {
// ...and here.
// Insert the line(s) between here...
d3.tsv("https://swizec.github.io/dl/barchart.tsv", function(d) {
// ...and here.
    d.frequency = +d.frequency;
    return d;
// Delete the line(s) between here...
  }, function(error, data) {
    if (error) throw error;
// ...and here.
// Insert the line(s) between here...
  }).then(function(data) {
// ...and here.
Same link, absolute version. And we updated the callback-based code to use the D3v5 promises version. That’s the most disruptive change going from v4 to v5 I believe.
That’s it. You now have a Barchart component that renders the example barchart from D3’s docs.
You can use it like this  I recommend adding this code to the main App component that CodeSandbox creates for you.
import Barchart from './Barchart';

// ...
return (
  <svg width="800" height="600">
    <Barchart x={10} y={10} width={400} height={300} />
  </svg>
)
But like I said, don’t use this in production. It’s great for quick prototypes, trying stuff out, or seeing how an existing visualization might fit your app.
A note about D3blackbox
To make your life easier, I have open sourced my version of the D3blackbox HOC. You can read more about it at d3blackbox.com
Works the same as the HOC we just built together, adds the anchor ref, props, and state to function arguments so it’s easier to use. No need to mess with this if you don’t want to
Install it from npm:
$ npm install d3blackbox
Then use it as you would your own HOC:
import React from "react";
import D3blackbox from "d3blackbox";
import * as d3 from "d3";

const Barchart = D3blackbox(function(anchor, props, state) {
    const svg = d3.select(anchor.current);
    // the rest of your D3 code
});

export default Barchart;
The function you pass into D3blackbox is still your full D3 render. Except now you can access important values directly without using this .
You can use my D3blackbox or build your own. What’s important is that you now understand how higher order components work.
s04e25 - The approach
Build scalable dataviz components with full integration
As useful as blackbox components are, we need something better if we want to leverage React’s rendering engine. The blackbox approach in particular struggles with scale. The more charts and graphs and visualizations on your screen, the slower it gets.
Someone once came to my workshop and said “We used the blackbox approach and it takes several seconds to re-render our dashboard on any change. I’m here to learn how to do it better.”
In our full-feature integration, React does the rendering and D3 calculates the props.
Our goal is to build controlled components that listen to their props and reconcile that with D3’s desire to use a lot of internal state.
There are two situations we can find ourselves in:
- We know for a fact our component’s props never change
- We think props could change
It’s easiest to show you with an example.
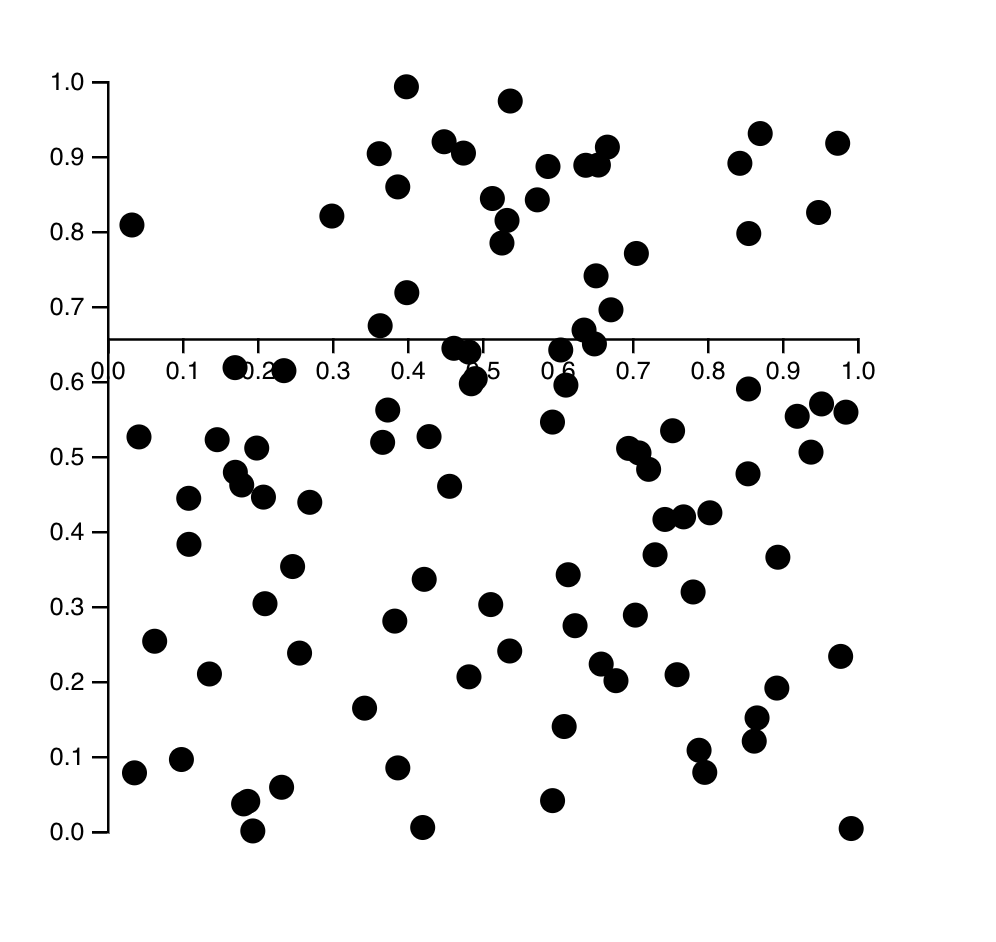
Let’s build a scatterplot step by step. Take a random array of two-dimensional data, render in a loop. Make magic.
Something like this
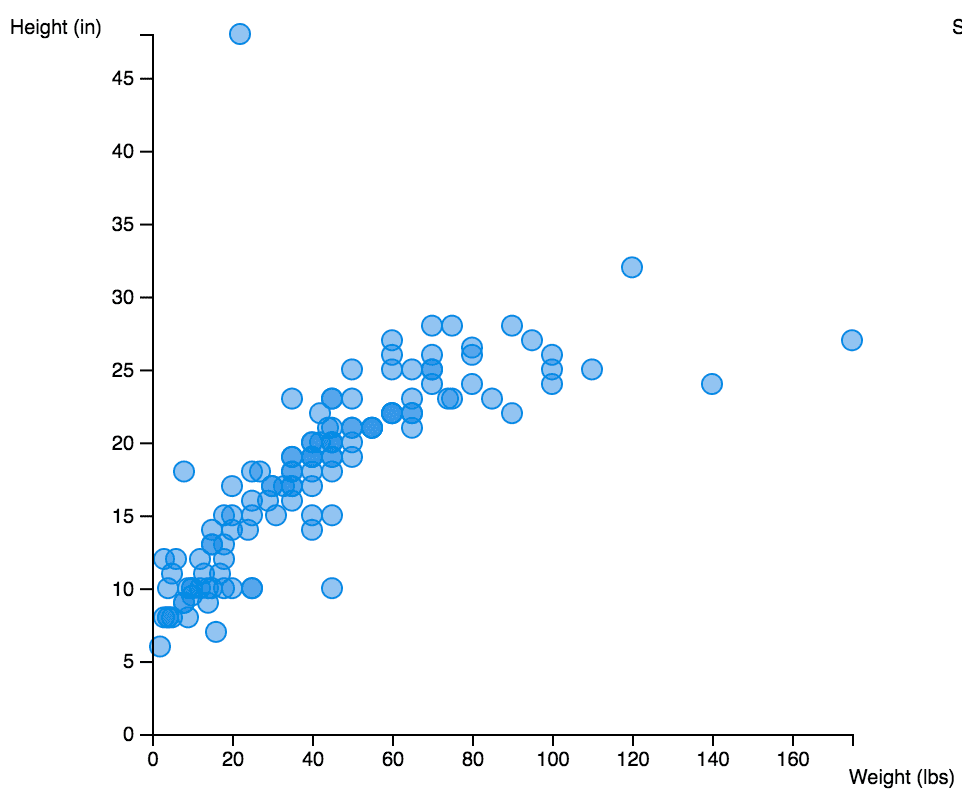
A simple scatterplot
You’ve already built the axes! Copy pasta time.
s04e26 - When props don’t change - a scatterplot
Props don’t change
Ignoring props changes makes our life easier, but the component less flexible and reusable. Great when you know in advance that there are features you don’t ned to support.
Like, no filtering your data or changing component size means your D3 scales don’t have to change.
When our props don’t change, we follow a 2-step integration process:
- set up D3 objects as class properties
- output SVG in
render()
We don’t have to worry about updating D3 objects on prop changes. Work done 
An unchanging scatterplot
We’re building a scatterplot of random data. You can see the final solution on CodeSandbox
Here’s the approach
- stub out the basic setup
- generate random data
- stub out Scatterplot
- set up D3 scales
- render circles for each entry
- add axes
I recommend creating a new CodeSandbox, or starting a new app with create-react-app. They should work the same.
Basic setup
Make sure you have d3 added as a dependency. Then add imports in your App.js file.
// ./App.js

import * as d3 from "d3";
import Scatterplot from "./Scatterplot";
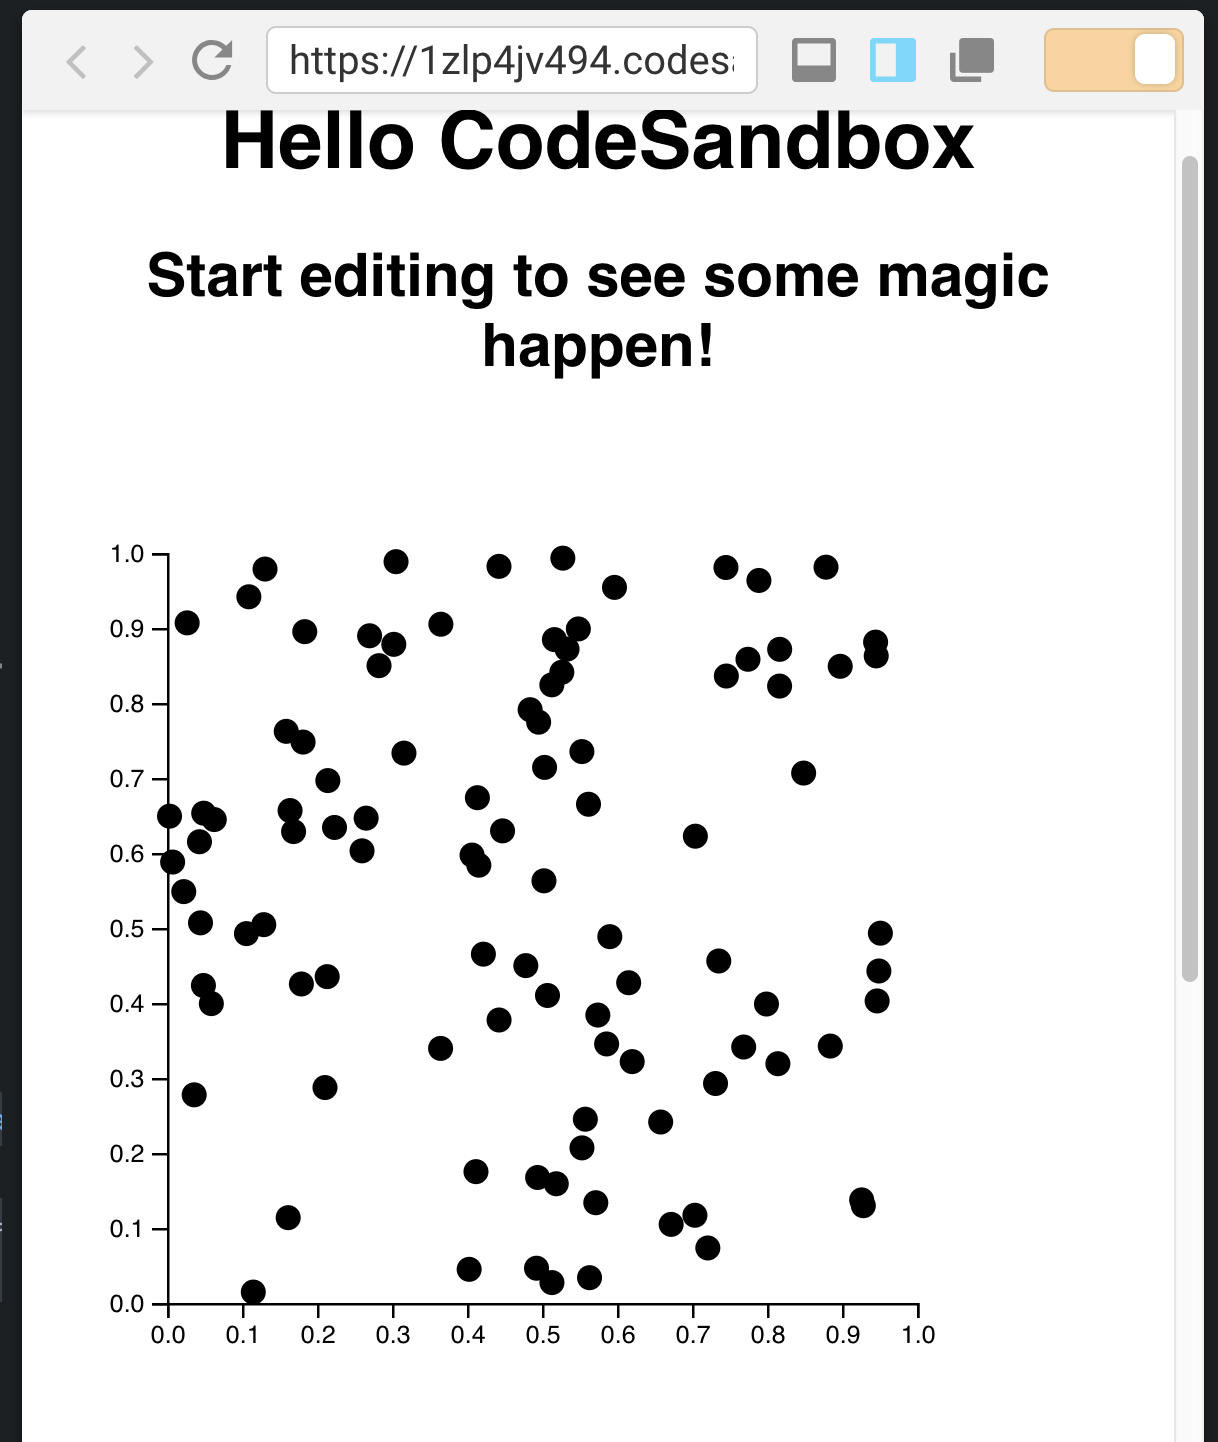
Add an <svg> and render a Scatterplot in the render method. This will throw an error because we haven’t defined the Scatterplot yet and that’s okay.
// ./App.js

function App() {
  return (
    <div className="App">
      <h1>Hello CodeSandbox</h1>
      <h2>Start editing to see some magic happen!</h2>
      <svg width="800" height="800">
        <Scatterplot x={50} y={50} width={300} height={300} data={data} />
      </svg>
    </div>
  );
}
CodeSandbox adds most of that code by default. If you’re using create-react-app, your App component has different markup. That’s okay too.
We added this part:
<svg width="800" height="800">
  <Scatterplot x={50} y={50} width={300} height={300} data={data} />
</svg>
An <svg> drawing area with a width and a height. Inside, a <Scatterplot that’s positioned at (50, 50) and is 300px tall and wide. We’ll have to listen to those props when building the Scatterplot.
It also accepts data.
Random data
We’re using a line of code to generate data for our scatterplot. Put it in App.js. Either globally or within the App function. Doesn’t matter because this is an example.
const data = d3.range(100)
               .map(_ => [Math.random(), Math.random()]);
d3.range returns a counting array from 0 to 100. Think [1,2,3,4 ...] .
We iterate over this array and return a pair of random numbers for each entry. These will be our X and Y coordinates.
Scatterplot
Our scatterplot goes in a new Scatterplot.js file. Starts with imports and an empty React component.
// ./Scatterplot.js
import React from "react";
import * as d3 from "d3";

class Scatterplot extends React.Component {

  render() {
    const { x, y, data, height } = this.props;

    return (
      <g transform={`translate(${x}, ${y})`}>

      </g>
    );
  }
}

export default Scatterplot;
Import dependencies, create a Scatterplot component, render a grouping element moved to the correct x and y position. Nothing too strange yet.
D3 scales
Now we define D3 scales as component properties. We’re using the class field syntax that’s common in React projects.
Technically a Babel plugin, but comes by default with CodeSandbox React projects and create-react-app setup. As far as I can tell, it’s a common way to write React components.
// ./Scatterplot.js
class Scatterplot extends React.Component {
  xScale = d3
    .scaleLinear()
    .domain([0, 1])
    .range([0, this.props.width]);
  yScale = d3
    .scaleLinear()
    .domain([0, 1])
    .range([this.props.height, 0]);
We’re defining this.xScale and this.yScale as linear scales. Their domains go from 0 to 1 because that’s what Math.random returns and their ranges describe the size of our scatterplot component.
Idea being that these two scales will help us take those tiny variations in datapoint coordinates and explode them up to the full size of our scatterplot. Without this, they’d overlap and we wouldn’t see anything.
Circles for each entry
Rendering our data points is a matter of looping over the data and rendering a <circle> for each entry. Using our scales to define positioning.
// ./Scatterplot.js

return (
  <g transform={`translate(${x}, ${y})`}>
    {data.map(([x, y]) => (
      <circle cx={this.xScale(:satisfied:} cy={this.yScale(y)} r="5" />
    ))}
  </g>
);
In the return statement of our render render method, we add a data.map with an iterator method. This method takes our datapoint, uses array destructuring to get x and y coordinates, then uses our scales to define cx and cy attributes on a <circle> element.
Add axes
You can reuse axes from our earlier exercise. Or copy mine from the CodeSandbox
Mine take a scale and orientation as props, which makes them more flexible. Means we can use the same component for both the vertical and horizontal axis on our Scatterplot.
Put the axis code in Axis.js , then augment the Scatterplot like this
import Axis from "./Axis";

// ...

return (
  <g transform={`translate(${x}, ${y})`}>
    {data.map(([x, y]) => (
      <circle cx={this.xScale(:satisfied:} cy={this.yScale(y)} r="5" />
    ))}
    <Axis x={0} y={0} scale={this.yScale} type="Left" />
    <Axis x={0} y={height} scale={this.xScale} type="Bottom" />
  </g>
);
Vertical axis takes the vertical this.yScale scale, orients to the Left and we position it top left. The horizontal axis takes the horizontal this.xScale scale, orients to the Bottom , and we render it bottom left.
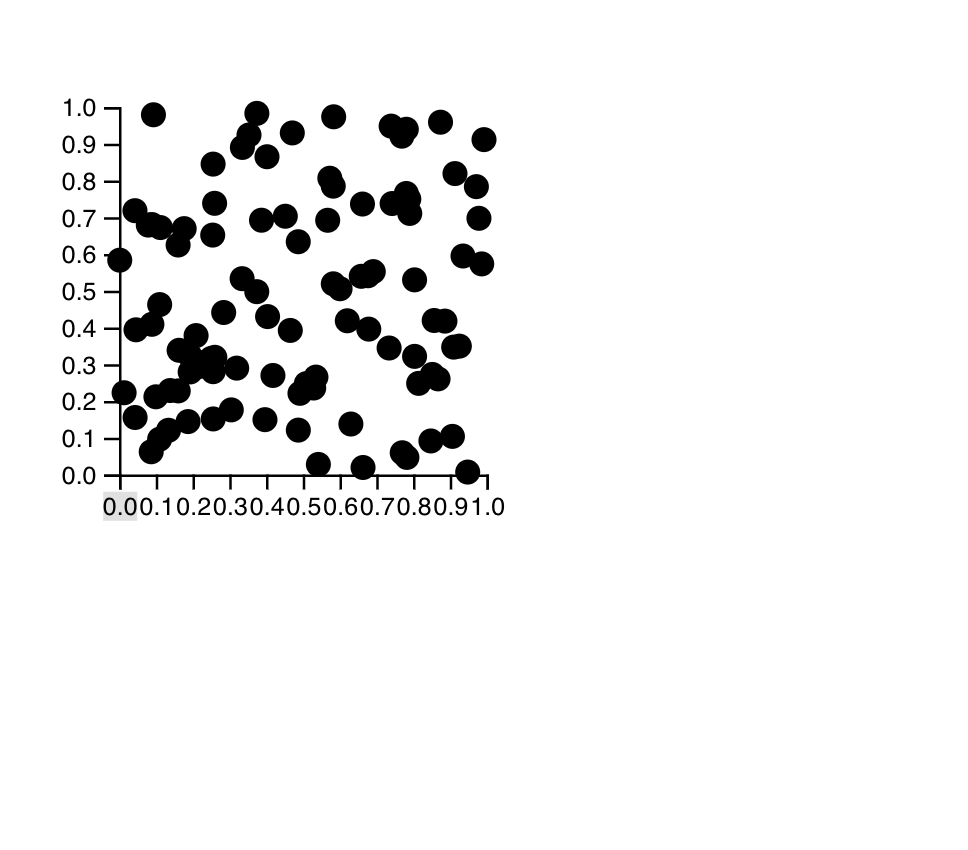
Your Scatterplot should now look like this
Rendered basic scatterplot
s04e27 - A scatterplot When props do change
Props might update
The story is a little different when our props might update. Since we’re using D3 objects to calculate SVG properties, we have to make sure those objects are updated before we render.
No problem in React 15: Update in componentWillUpdate . But since React 16.3 we’ve been told never to use that again. Causes problems for modern async rendering.
The official recommended solution is that anything that used to go in componentWillUpdate , can go in componentDidUpdate . But not so fast!
Updating D3 objects in componentDidUpdate would mean our visualization always renders one update behind. Stale renders! 
The new getDerivedStateFromProps to the rescue. Our integration follows a 3-step pattern:
- set up D3 objects in component state
- update D3 objects in
getDerivedStateFromProps - output SVG in
render()
getDerivedStateFromProps is officially discouraged, and yet the best tool we have to make sure D3 state is updated before we render.
Because React calls getDerivedStateFromProps on every component render, not just when our props actually change, you should avoid recalculating complex things too often. Use memoization helpers, check for changes before updating, stuff like that.
An updateable scatterplot
Let’s update our scatterplot so it can deal with resizing and updating data.
3 steps
- add an interaction that resizes the scatterplot
- move scales to state
- update scales in
getDerivedStateFromProps
You can see my final solution on CodeSandbox. I recommend you follow along updating your existing code.
Resize scatterplot on click
To test our scatterplot’s adaptability, we have to add an interaction: Resize the scatterplot on click.
That change happens in App.js . Click on the <svg> , reduce width and height by 30%.
Move sizing into App state and add an onClick handler.
// App.js
class App extends React.Component {
  state = {
    width: 300,
    height: 300
  };

  onClick = () => {
    const { width, height } = this.state;
    this.setState({
      width: width * 0.7,
      height: height * 0.7
    });
  };

  render() {
    const { width, height } = this.state;
We changed our App component from a function to a class, added state with default width and height , and an onClick method that reduces size by 30%. The render method reads width and height from state.
Now gotta change rendering to listen to these values and fire the onClick handler.
// App.js

<svg width="800" height="800" onClick={this.onClick}>
  <Scatterplot
    x={50}
    y={50}
    width={width}
    height={height}
    data={data}
  />
</svg>
Similar rendering as before. We have an <svg> that contains a <Scatterplot> . The svg fires this.onClick on click events and the scatterplot uses our width and height values for its props.
If you try this code now, you should see a funny effect where axes move, but the scatterplot doesn’t resize.
Axes move, scatterplot doesn’t resize
Peculiar isn’t it? Try to guess why.
Move scales to state
The horizontal axis moves because it’s render at height vertical coordinate. Datapoints don’t move because the scales that position them are calculated once – on component mount.
First step to keeping scales up to date is to move them from component values into state.
// Scatterplot.js
class Scatterplot extends React.Component {
  state = {
    xScale: d3
      .scaleLinear()
      .domain([0, 1])
      .range([0, this.props.width]),
    yScale: d3
      .scaleLinear()
      .domain([0, 1])
      .range([this.props.height, 0])
  };
Same scale definition code we had before. Linear scales, domain from 0 to 1, using props for ranges. But now they’re wrapped in a state = {} object and it’s xScale: d3 ... instead of xScale = d3 ... .
Our render function should use these as well. Small change:
// Scatterplot.js
  render() {
    const { x, y, data, height } = this.props,
      { yScale, xScale } = this.state;

    return (
      <g transform={`translate(${x}, ${y})`}>
        {data.map(([x, y]) => <circle cx={xScale(:satisfied:} cy={yScale(y)} r="5" />😉}
We use destructuring to take our scales from state, then use them when mapping over our data.
Clicking on the SVG produces the same result as before, but we’re almost there. Just one more step.
Update scales in getDerivedStateFromProps
Last step is to update our scales’ ranges in getDerivedStateFromProps . This method runs every time React touches our component for any reason.
// Scatterplot.js
class Scatterplot extends React.PureComponent {
  // ..
  static getDerivedStateFromProps(props, state) {
    const { yScale, xScale } = state;

    yScale.range([props.height, 0]);
    xScale.range([0, props.width]);

    return {
      ...state,
      yScale,
      xScale
    };
  }
Take scales from state, update ranges with new values, return new state. Nice and easy.
Notice that getDerivedStateFromProps is a static method shared by all instances of our Scatterplot component. You have no reference to a this and have to calculate new state purely from the props and state passed into your method.
It’s a lot like a Redux reducer, if that helps you think about it. If you don’t know what Redux reducers are, don’t worry. Just remember to return a new version of component state.
Your Scatterplot should now update its size on every click.
Scatterplot resizes
s04e28 - Making your components more flexible with render props
Making your components more flexible with render props
Our scatterplot doesn’t look quite as nice as the earlier screenshot. Regular SVG circles with no styling just can’t match up.
What if we wanted to render beautiful circles? Or stars? Or maybe something else entirely?
We can use render props to give users of our scatterplot component the power to define how they want datapoints to render.
Think of it as a sort of inversion of control. Another common buzzword are “slots”, or renderless components. The idea is that one of our props accepts a React component.
We then use that prop to render our datapoints.
It looks a little like this
<Scatterplot
  x={10} y={10}
  data={data}
  datapoint={(props) => <Datapoint {...props} />}
>
What’s more, we can add interactions and other useful stuff to our <Datapoint> and <Scatterplot> doesn’t have to know anything about it. All the scatterplot cares about is rendering two axes and a bunch of datapoints.
Let’s use the render prop approach to make our scatterplot more reusable.
Steps
- pass in a render prop
- use it to render datapoints
- make datapoint component look nice
You can see my solution on CodeSandbox. I recommend you follow along with your existing code.
Pass in a render prop
React components are Just JavaScript. Either a JSX function call or a function that returns some JSX.
That means we can pass them into components via props. Let’s do that in App.js
// App.js

import Datapoint from "./Datapoint";

//..
<svg width="800" height="800" onClick={this.onClick}>
  <Scatterplot
    x={50}
    y={50}
    width={width}
    height={height}
    data={data}
    datapoint={({ x, y }) => <Datapoint x={x} y={y} />}
  />
</svg>
For extra flexibility and readability we’re wrapping our <Datapoint> component in another function that accepts x and y coordinates. This is a common pattern you’ll see with render props it gives you the ability to pass in props from both the rendering component and the component that’s setting the render prop.
Say we wanted Datapoint to know something about our App and our Scatterplot. The scatterplot calls this function with coordinates. We pass those into <Datapoint> . And because the method is defined inside App, we could pass-in anything that’s defined in the App. Like perhaps data .
Your code will start throwing an error now. Datapoint isn’t defined. Don’t worry, it’s coming soon.
Use render prop to render datapoints
To use our new datapoint render prop, we have to change how we render the scatterplot. Instead of returning a <circle> for each iteration of the dataset, we’re calling a function passed in from props.
// Scatterplot.js
  render() {
    const { x, y, data, height, datapoint } = this.props,
      { yScale, xScale } = this.state;

    return (
      <g transform={`translate(${x}, ${y})`}>
        {data.map(([x, y]) => datapoint({
            x: xScale(:satisfied:,
            y: yScale(y)
        }))}
We take the datapoint function from props and call it in data.map making sure to pass in x and y as an object. Calling functions with objects like this is a common JavaScript pattern to fake named arguments.
Make datapoint component look nice
We’ve got all the rendering, now all we need is the <Datapoint component itself. That goes in a new Datapoint.js file.
import React from "react";
import styled from "styled-components";

const Circle = styled.circle`
  fill: steelblue;
  fill-opacity: .7;
  stroke: steelblue;
  stroke-width: 1.5px;
`;

class Datapoint extends React.Component {
  render() {
    const { x, y } = this.props;

    return (
      <Circle
        cx={x}
        cy={y}
        r={3}
      />
    );
  }
}

export default Datapoint;
I’m using styled-components to define the CSS for my Datapoint. You can use whatever you prefer. I like styled components because they’re a good balance between CSS-in-JS and normal CSS syntax.
The component itself renders a styled circle using props for positioning and a radius of 3 pixels.
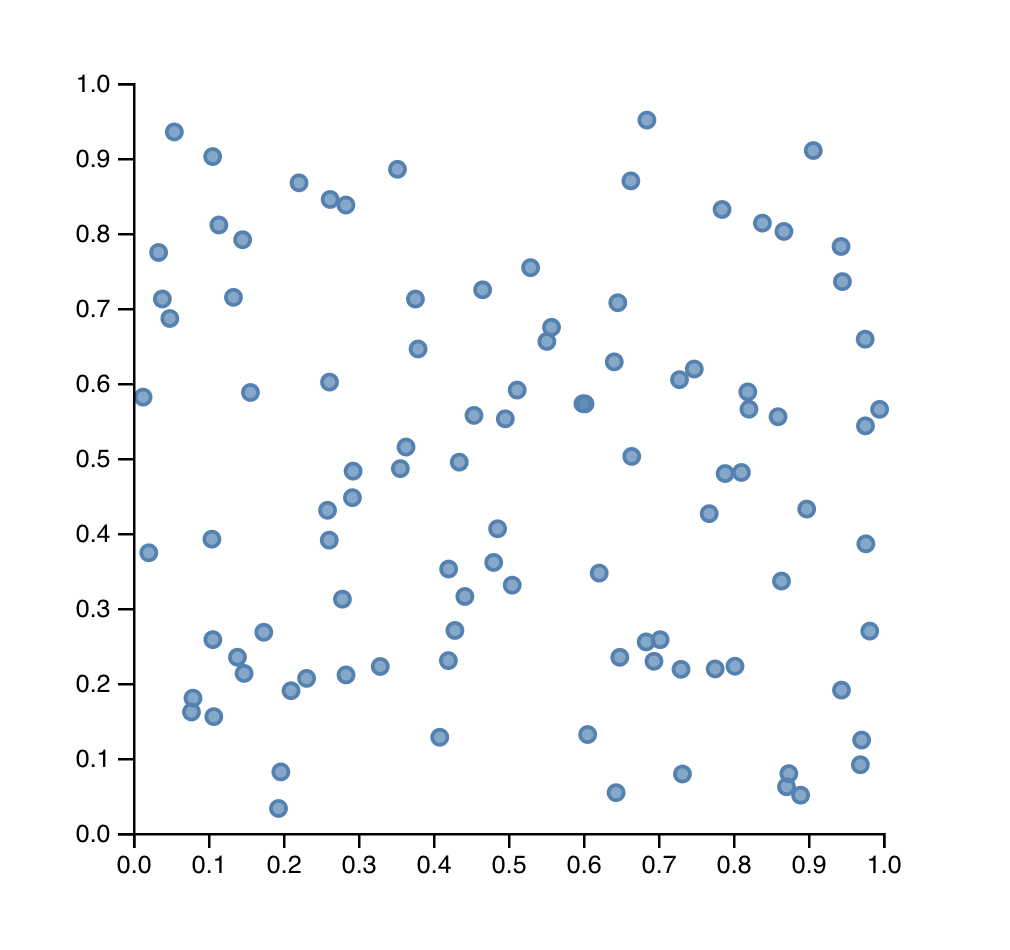
Finished scatterplot
For an extra challenge, try rendering circle radius from state and changing datapoint size on mouse over. Make the scatterplot interactive.
s05e29 - 
You’re awesome
You know the basics!
You can take any D3 example from the internets and wrap it in a React component, and you know how to build React+D3 components from scratch. You’re amazing. High five! 
The rest of this book is about using these concepts and pushing them to the limits of practicality. We’re going to build an interactive visualization of tech salaries compared to median household income.
Why? Because it piqued my interest, and because it shows why you should call yourself an engineer, not a programmer or a developer. You’re an engineer . Remember that.
Throughout the example, you’ll learn more details of D3, tidbits from React, and the animation chapter is going to blow your mind.
Super fun!
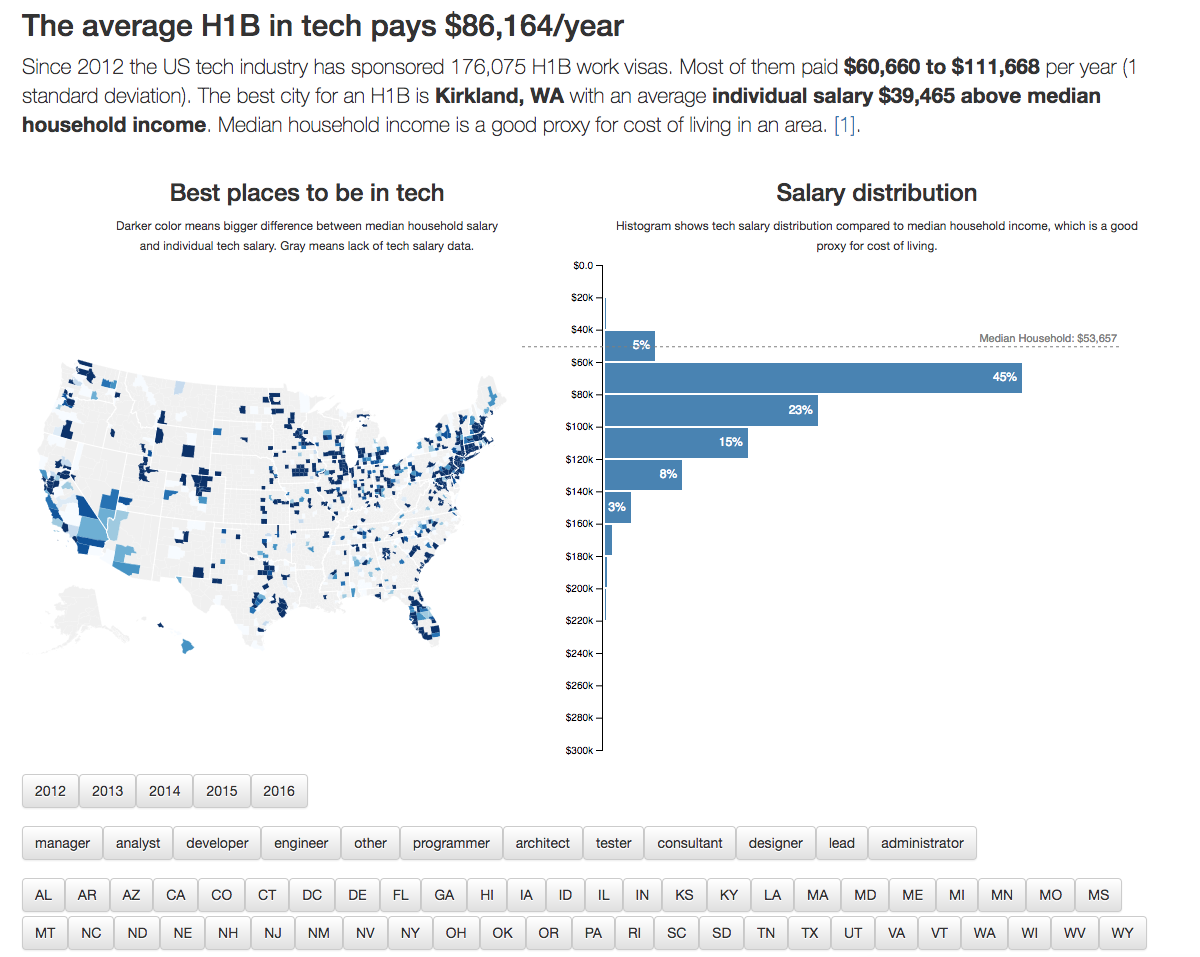
Default view

After a click
s06e30 - Handling state in your React app
Handling state in your React app
Before I can set you loose on the world, we should talk about managing state. It’s where most engineers shoot themselves in the foot.
You’ll notice you shot yourself in the foot six months ago when all of a sudden it becomes near impossible to build new features, add functionality, and know what’s going on with your app. If you find yourself spending a lot of time confused about why your UI does something, you’ve shot yourself in the foot.
Don’t worry tho, happens to everyone!
I shoot myself in the foot all the time. You can’t predict how your app is going to evolve. You can’t know how technology is going to improve. Can’t know how your team will grow.
Best approach is to optimize for change.
Otherwise you might have to do a rewrite. Rewrites are bad. One of the most infamous rewrite story is about The Rewrite that Killed Netscape. You might not even have heard of Netscape 
Let’s save you from that.
s06e31 - Basic architecture we’ll use
Basic architecture
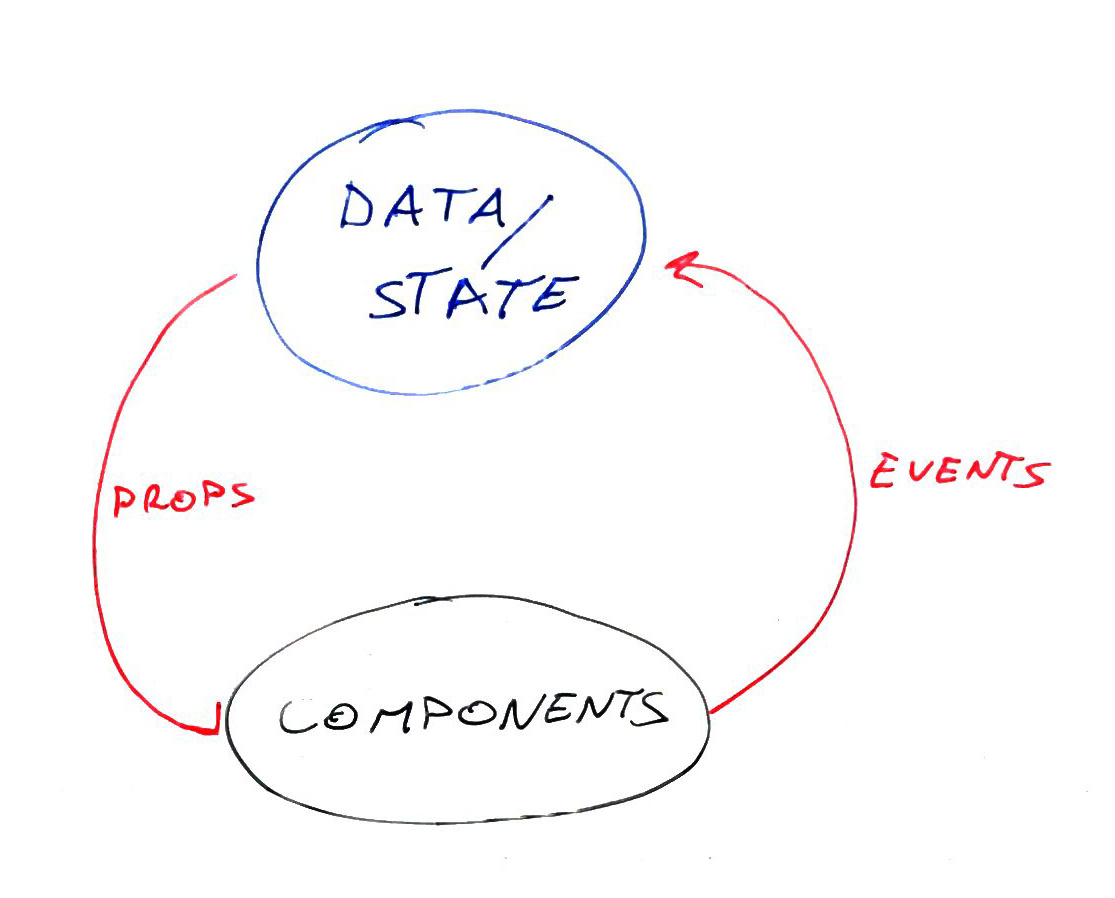
Unidirectional data flow
We’re using a unidirectional data flow architecture with a single source of truth. That means you always know what to expect. Think of your app as a giant circle.
Data goes from your source of truth into your components. Events go from your components into your source of truth. All in one direction
The basic architecture
Our main App component holds state for your entire application. Anything that multiple components should be aware of lives here. This state flows down the hierarchy via props. Changes happen via callbacks, also passed down through props.
Like this
- The Main Component –
App– holds the truth - Truth flows down through props
- Child components react to user events
- They announce changes using callbacks
- The Main Component updates its truth
- Updates flow back down the chain
- UI updates through re-renders
This looks roundabout, but it’s amazing. Far better than worrying about parts of the UI growing out of sync with the rest of your app. I could talk your ear off with debugging horror stories, but I’m nice, so I won’t.
When a user clicks one of our controls, a Toggle , it invokes a callback. This in turn invokes a callback on ControlRow , which invokes a callback on Controls , which invokes a callback on App .
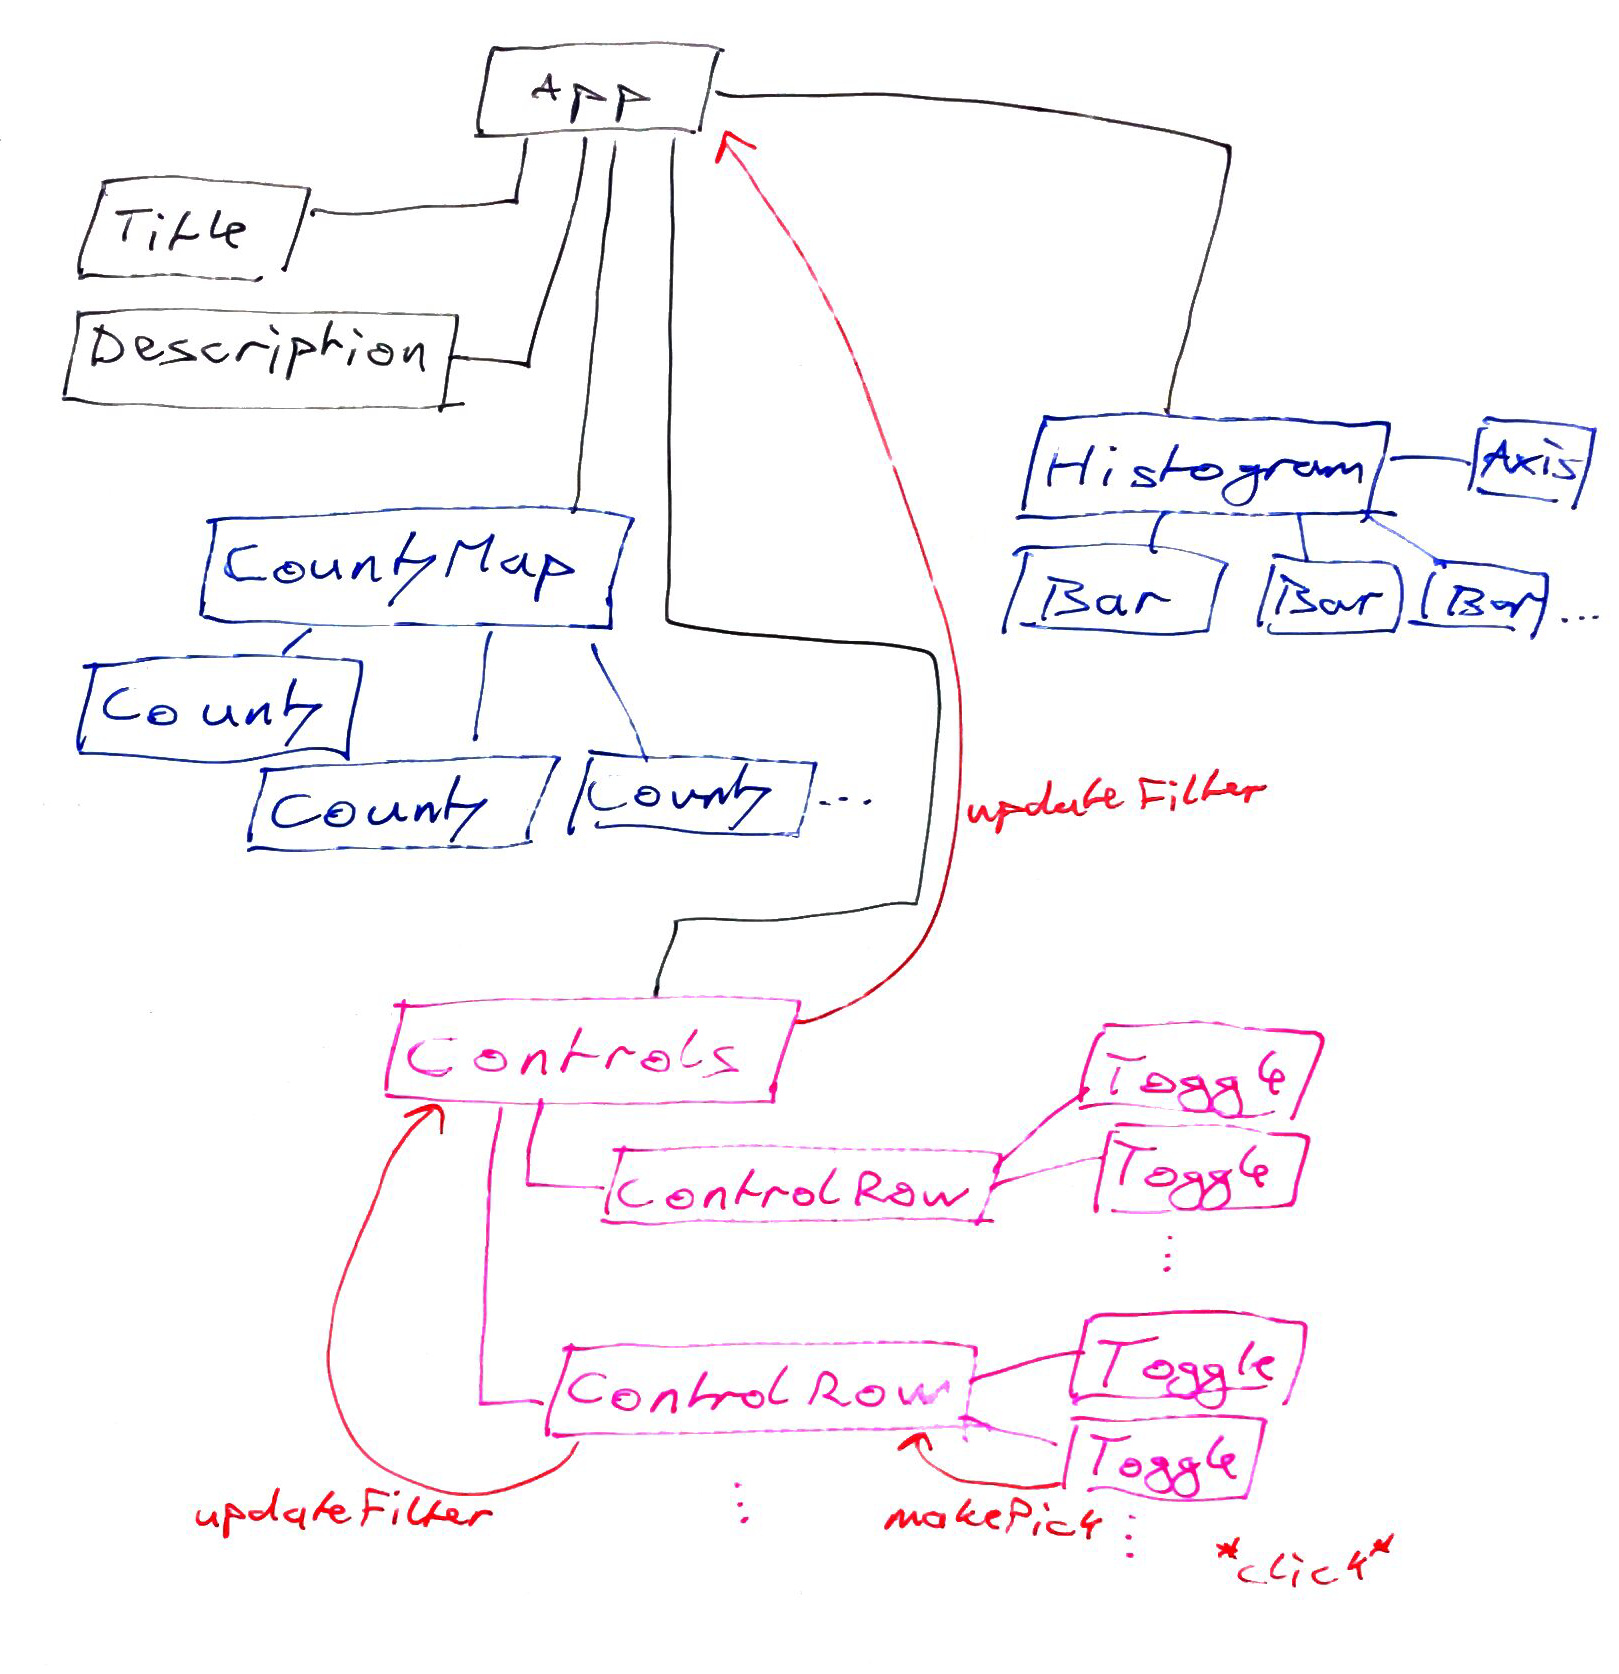
Callback chain
With each hop, the nature of our callback changes. Toggle tells ControlRow which entry was toggled, ControlRow tells Controls how to update the data filter function, and Controls gives App a composite filter built from all the controls. You’ll see how that works in the next chapter.
All you have to remember right now is that callbacks evolve from passing low-level information to high-level business logic. Starts with “I was clicked” ends with “Update visualization filter”
When the final callback is invoked, App updates its repository of truth – this.state – and communicates the change back down the chain via props. No additional wiring needed on your part. React’s got you covered.

Data flows down
You can think of it like calling functions with new arguments. Because the functions – components – render the UI, your interface updates.
Because your components are well-made and rely on their props to render, React’s engine can optimize these changes. It compares the new and old component trees and decides which components to re-render and which to leave alone.
Functional programming for HTML! 
The functional programming concepts we’re relying on are called referential transparency, idempotent functions, and functional purity. I suggest Googling them if you want to learn the theory behind it all.
s06e32 - What about React Context? Redux? MobX?
What about React Context? Redux? MobX?
You may have heard of React Context, Redux, MobX and other state handling libraries. They’re all great in different ways and the internet can’t decide which one is best. Everyone has their own little twist on the story.
And yet the basic principles are all the same:
- Single source of truth
- State flows down
- Updates flow up
Where React Context, Redux, MobX and other libraries help, is how much work it is to build this machinery and keep it running. How much flexibility you get when moving components. Basically how easy it is to change your app later.
Remember the rewrite conundrum?
Our basic approach binds business structure to UI structure. Your state, your props, your callbacks, they all follow the same hierarchy as your UI does.
Want to move the buy button? Great! You have to update the entire chain of components leading from your state to that button.
Everything needs new callbacks and new props.
This is known as prop drilling and fast becomes super tedious. Rewiring your whole app just to move a single button is no fun.
To solve this problem, React Context, Redux, MobX, etc. decouple your business logic from your UI architecture. Take state out of the main component and move it into its own object. Connect everything to that instead.
[picture]
Now it doesn’t matter where you move that button. It still triggers the same function on the same state. Every other component that cares about that state updates too.
Different libraries have different details for how that works, but they all follow the same idea and solve the same problem.
We’re sticking with the basic approach because it’s easier to explain, works without additional libraries, and is Good Enough™.
s06e33 - How to structure your app
How to structure your app
Our app is built from components. You already know how components work. Where it gets tricky is deciding where one component ends and another beings.
One of the hardest problems in software engineering I’d say. Defining the boundaries and interfaces between objects. Entire books have been written on the subject.
You’ll learn most of it with experience. Just through trying different approaches, seeing what works, and developing your taste. Like a chef gets better at improvisation the more things they try. Or a musician.
To get you started, here’s a rule of thumb that I like to use: if you have to use the word “and” to describe what your component does, then it should become two components. If you build the same feature multiple times, turn it into a component.
You can then remix components into larger components where it makes sense, or you can keep them separate. It makes sense to combine when multiple small components have to work together to build a big feature.
This architecture often mimics the design of your UI.
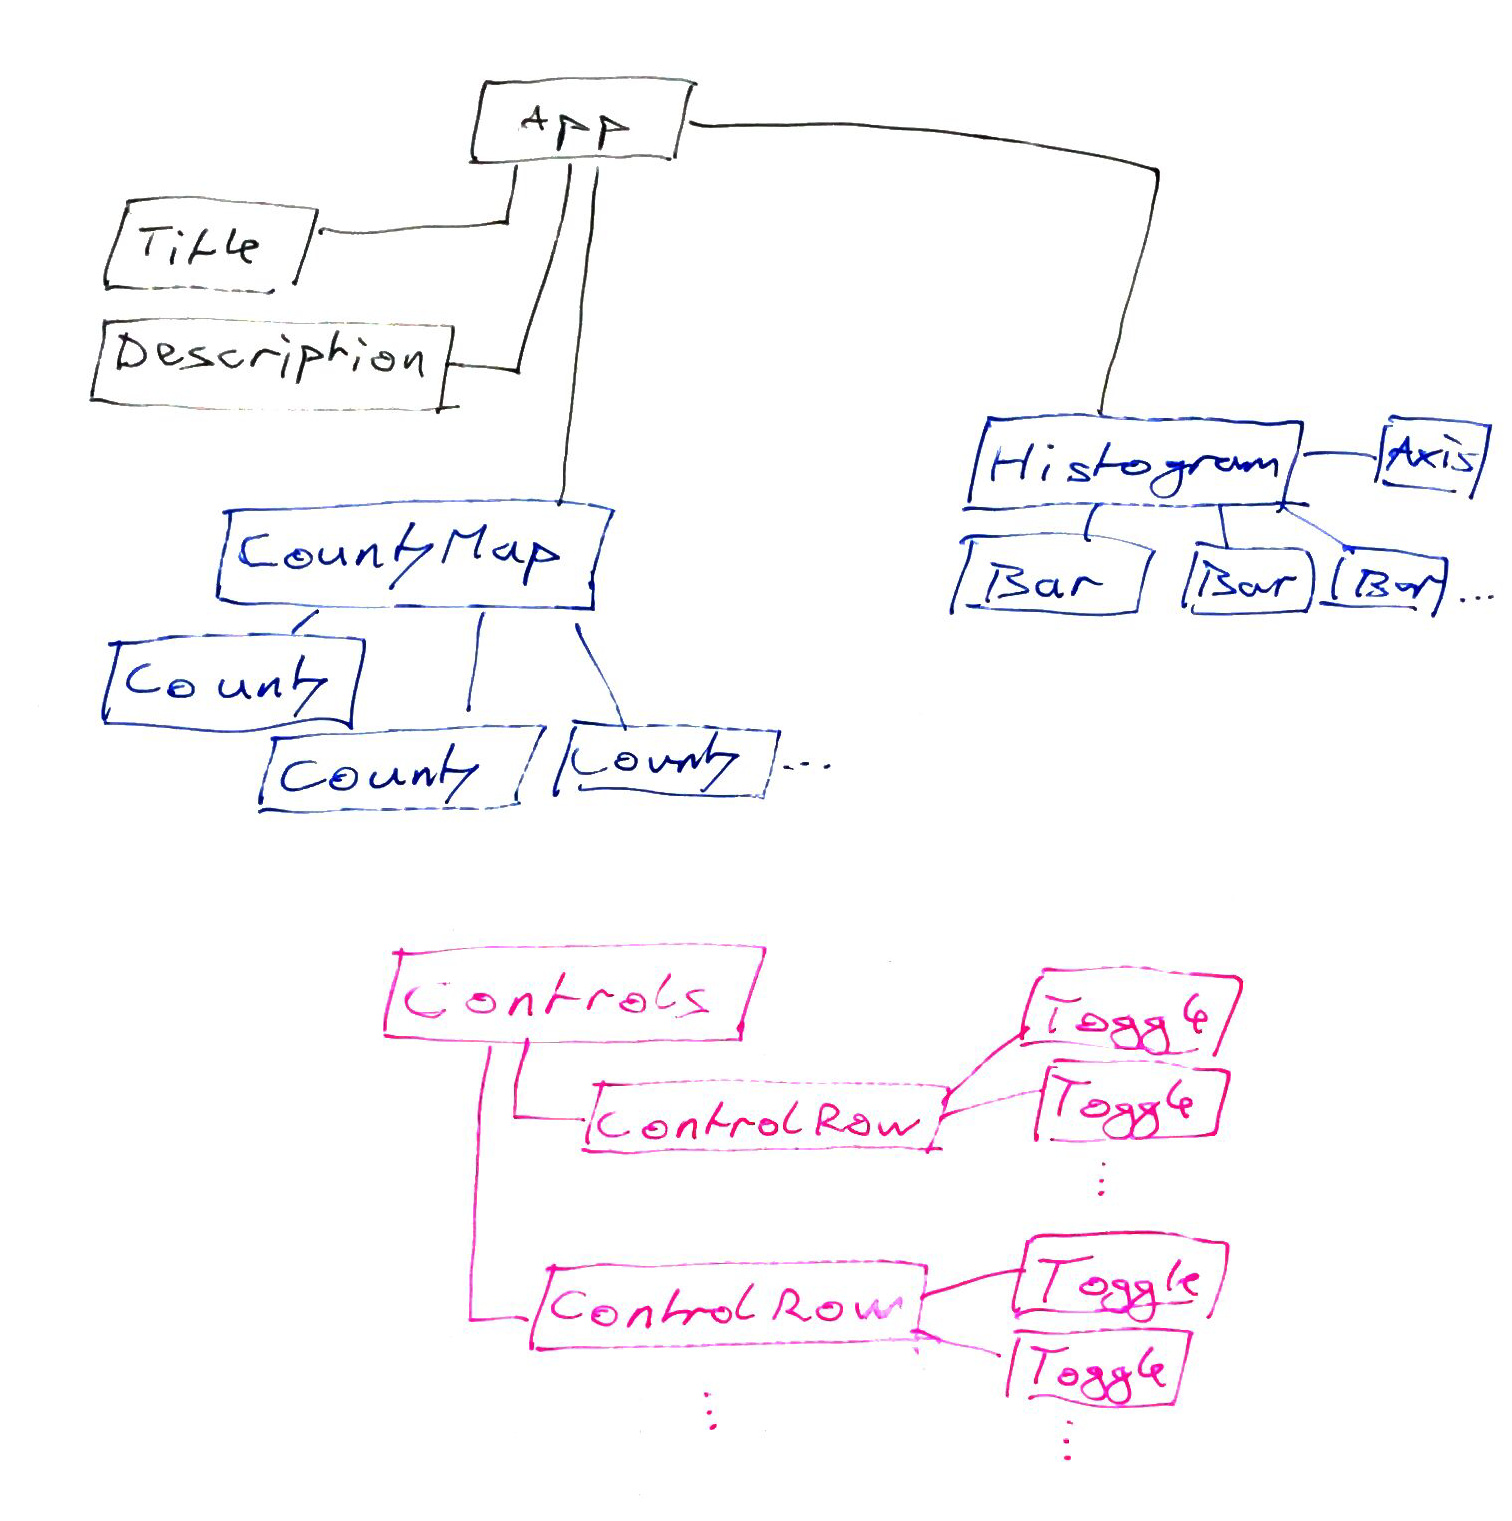
For example: our tech salary visualization is going to use 1 very top level component, 5 major components, and a bunch of child components.
-
Appis the very top level component; it keeps everything together -
Titlerenders the dynamic title -
Descriptionrenders the dynamic description -
Histogramrenders the histogram and has child components for the axis and histogram bars -
CountyMaprenders the choropleth map and uses child components for the counties -
Controlsrenders the rows of buttons that let users explore our dataset
Most of these are specific to our use case, but Histogram and CountyMap have potential to be used elsewhere. We’ll keep that in mind when we build them.
Histogram , CountyMap , and Controls are going to have their own folder inside src/components/ to help us group major components with their children. An index.js file will help with imports.
We’ll use a Meta folder for all our metadata components like Title and Description . We don’t have to do this, but import { Title, Description } from './Meta' looks better than separate imports for related-but-different components. Namespacing, if you will.
We want to access every component with import My Component from './MyComponent' and render as <MyComponent {...params} /> . Something is wrong, if a parent component has to know details about the implementation of a child component.
You can read more about these ideas by Googling “leaky abstractions”, “single responsibility principle”, “separation of concerns”, and “structured programming”. Books from the late 90’s and early 2000’s (when object-oriented programming was The Future™) have the best curated info in my experience.
s06e34 - Congratz!
Congratz! You know everything you need to build visualizations with React and D3. 
This is the point in tech books where I run off and start building things on my own. Then I get frustrated, spend hours Googling for answers, and then remember, “Hey! Maybe I should read the rest of the book!”
Reading the rest of the book helps. I’ll show you how all this fits together into a larger project.
s07e35 - Local environment setup
Set up a local environment with create-react-app
Can you believe this is the third time I’m writing a “How to set up all the tools and get started” section? The ecosystem moves fast!
You can see the old versions in the ebook as Appendix A – a roll-your-own environment that’s almost the same as the one I’m about to show you, and Appendix B – a browserify-based environment (if you don’t like Webpack).
In the summer of 2016, the React team released a tool called create-react-app . It creates a React app so that you can get started right away. All of the code in this book runs with an app set up like this.
Getting started with React has never been easier.
- Make sure you have node.js
- Install the app generator
- Run the app generator
s07e36 - Start with create-react-app
Make sure you have node.js
Modern JavaScript development runs on node.js. Your code still ends up in a browser, but there are a few steps it has to go through before it gets there. Those toolchains run on node.js.
Go to nodejs.org, download one of the latest versions, and run the installer. You can pick the more stable LTS (long-term-support) version, or the more gimme-all-the-features version. JavaScript toolchains run fine in both.
Server-side rendering might be easier with the fancy-pants version. More on that later.
Install create-react-app
Great, you have node and you’re ready to go.
Run this command in a terminal:
$ npm install -g create-react-app
This installs a global npm package called create-react-app . Its job is to create a directory and install react-scripts .
Confusing, I know.
You can think of create-react-app and react-scripts as two parts of the same construction. The first is a lightweight script that you can install globally and never update; the second is where the work happens. You want this one to be fresh every time you start a new app.
Keeping a global dependency up to date would suck, especially considering there have been six major updates since Facebook first launched create-react-app in July 2016.
Run create-react-app
Superb! You have create-react-app . Time to create an app and get started with some coding.
Run this in a terminal:
$ create-react-app react-d3js-example
Congratulations! You just created a React app. With all the setup and the fuss that goes into using a modern JavaScript toolchain.
Your next step is to run your app:
$ cd react-d3js-example
$ npm start
A browser tab should open with a page that looks like this:
Initial React app
If that didn’t work, then something must have gone terribly wrong. You should consult the official docs. Maybe that will help.
s07e37 - What you get
What you get
Running create-react-app installs tools and libraries. There’s around 80MB of them as of October 2016. This is why using a generator is easier than slogging through on your own.
Crucially, there is a single dependency in your project – react-scripts . But it gives you everything you need to build modern React apps.
- Webpack - a module bundler and file loader. It turns your app into a single JavaScript file, and it even lets you import images and styles like they were code.
- Babel - a JavaScript transpiler. It turns your modern JS code (ES6, ECMAScript2015, 2016, ES7, whatever you call it) into code that can run on real world browsers. It’s the ecosystem’s answer to slow browser adoption.
-
ESLint - linting! It annoys you when you write code that is bad. This is a good thing.

- Jest - a test runner. Having tests set up from the beginning of a project is a good idea. We won’t really write tests in this book, but I will show you how it’s done.
All tools come preconfigured with sane defaults and ready to use. You have no idea how revolutionary this is. Check the appendixes to see how hard setting up an environment used to be. I’m so happy that create-react-app exists.
Besides the toolchain, create-react-app also gives you a default directory structure and a ton of helpful docs.
You should read the README.md file. It’s full of great advice, and it goes into more detail about the app generator than we can get into here. The team also makes sure it’s kept up-to-date.
All of the code samples in this book are going to follow the default directory structure. Public assets like HTML files, datasets, and some images go into public/ . Code goes into src/ .
Code is anything that we import or require() . That includes JavaScript files themselves, as well as stylesheets and images.
You can poke around src/App.js to see how it’s structured and what happens when you change something. You’re going to change bits and pieces of this file as you go through the book.
I suggest you keep npm start running at all times while coding. The browser will refresh on every code change, so you’ll be able to see instant results.
s07e38 - Install extra dependencies
Install dependencies for React for Datavisualization
There are a couple of libraries we’re going to use often in this book: D3, Topojson, and Lodash. We’re using D3 to do our heavy lifting, Topojson to parse geographical data, and Lodash to make data manipulation easier.
You can install them like this:
$ npm install --save d3 topojson lodash
Additionally, we’re using Bootstrap for default styling and String for string manipulation. You should install them as well.
$ npm install --save bootstrap string
Now your environment is ready! You should see a default React App page in the browser without errors. Keep npm start running as you follow the examples in this book.
Some examples are going to need other libraries. When that happens, I’ll remind you to install them.