Use the Raft cluster#
Ok, now that we have our basic building blocks, let’s put them all together. In our server.go , we can call all of the methods we just built:
package main

import (
	"encoding/json"
	"fmt"
	"io/ioutil"
	"net/http"
	"os"

	"github.com/fullstackio/reliable-go/distributed-key-value-store/store"
	"github.com/go-chi/chi"
	hclog "github.com/hashicorp/go-hclog"
)

var (
	log = hclog.Default()
)

func main() {
	// Get port from env variables or set to 8080.
	port := "8080"
	if fromEnv := os.Getenv("PORT"); fromEnv != "" {
		port = fromEnv
	}
	log.Info(fmt.Sprintf("Starting up on http://localhost:%s", port))

	storagePath := "/tmp/kv"
	if fromEnv := os.Getenv("STORAGE_PATH"); fromEnv != "" {
		storagePath = fromEnv
	}

	host := "localhost"
	if fromEnv := os.Getenv("RAFT_ADDRESS"); fromEnv != "" {
		host = fromEnv
	}

	raftPort := "8081"
	if fromEnv := os.Getenv("RAFT_PORT"); fromEnv != "" {
		raftPort = fromEnv
	}

	leader := os.Getenv("RAFT_LEADER")
	config, err := store.NewRaftSetup(storagePath, host, raftPort, leader)
	if err != nil {
		log.Error("cloudn't set up Raft", "error", err)
		os.Exit(1)
	}

	r := chi.NewRouter()
	r.Use(config.Middleware)
	r.Get("/", func(w http.ResponseWriter, r *http.Request) {
		w.Header().Set("Content-Type", "application/json; charset=utf-8")
		jw := json.NewEncoder(w)
		jw.Encode(map[string]string{"hello": "world"})
	})

	r.Post("/raft/add", config.AddHandler())
	r.Post("/key/{key}", func(w http.ResponseWriter, r *http.Request) {
		w.Header().Set("Content-Type", "application/json; charset=utf-8")
		jw := json.NewEncoder(w)
		key := chi.URLParam(r, "key")
		body, err := ioutil.ReadAll(r.Body)
		if err != nil {
			w.WriteHeader(http.StatusInternalServerError)
			jw.Encode(map[string]string{"error": err.Error()})
			return
		}

		if err := config.Set(r.Context(), key, string(body)); err != nil {
			w.WriteHeader(http.StatusInternalServerError)
			jw.Encode(map[string]string{"error": err.Error()})
			return
		}

		jw.Encode(map[string]string{"status": "success"})
	})

	r.Get("/key/{key}", func(w http.ResponseWriter, r *http.Request) {
		key := chi.URLParam(r, "key")

		data, err := config.Get(r.Context(), key)
		if err != nil {
			w.WriteHeader(http.StatusInternalServerError)
			w.Header().Set("Content-Type", "application/json; charset=utf-8")
			jw := json.NewEncoder(w)
			jw.Encode(map[string]string{"error": err.Error()})
			return
		}

		w.Write([]byte(data))
	})

	r.Delete("/key/{key}", func(w http.ResponseWriter, r *http.Request) {
		key := chi.URLParam(r, "key")
		w.Header().Set("Content-Type", "application/json; charset=utf-8")
		jw := json.NewEncoder(w)

		if err := config.Delete(r.Context(), key); err != nil {
			w.WriteHeader(http.StatusInternalServerError)
			jw.Encode(map[string]string{"error": err.Error()})
			return
		}

		jw.Encode(map[string]string{"status": "success"})
	})

	http.ListenAndServe(":"+port, r)
}
Note we are importing our new store package. We aren’t specifying any file, and we are giving the full path, instead of a relative path as you might be used to in other languages. We got that full path by taking the module line from our go.mod : module github.com/fullstackio/reliable-go/distributed-key-value-store , and then adding the module name from the package line in our files: store , to get "github.com/fullstackio/reliable-go/distributed-key-value-store/store" .
We have talked about most of this stuff before. You can see that we are calling our factory to generate a new configuration. Then we are using that to create middleware and handlers to use in our server.
Now to the final part, actually storing our data!
Keeping data in sync#
You might have noticed back in our NewRaftSetup function, we had a line
cfg.fsm = &fsm{
   dataFile: fmt.Sprintf("%s/data.json", storagePath),
}
The fsm type is implemented in our store package, and implements hashicorp/raft 's FSM interface. FSM stands for finite state machine . According to the docs, an FSM implementation needs to have three functions:
Apply(*Log) interface{}
Snapshot() (FSMSnapshot, error)
Restore(io.ReadCloser) error
As such, we need to create a new struct that has those three functions to replicate our data. Apply will change our local state. Snapshot will take a snapshot of our state. Restore will overwrite our local state with a snapshot. We will also need to implement the FSMSnapshot interface, which requires two functions:
Persist(sink SnapshotSink) error
Release()
To start, we will create two structs to store our data.
type fsm struct {
	dataFile string
	lock     *flock.Flock
}

type fsmSnapshot struct {
	data []byte
}
Our fsm type will have a file path where data is stored, and a file lock, so that our process will only do one action at a time. We are using flock to implement our file lock. We could do it ourselves with Go’s sync.Mutex, but flock is a bit higher-level, and makes things easier for us.
The first thing we need to do is implement the interface functions that the raft library requires. The docs for the interface say:
Apply log is invoked once a log entry is committed. It returns a value which will be made available in the ApplyFuture returned by Raft.Apply method if that method was called on the same Raft node as the FSM.
func (f *fsm) Apply(l *raft.Log) interface{} {
	log.Info("fsm.Apply called", "type", hclog.Fmt("%d", l.Type), "data", hclog.Fmt("%s", l.Data))

	var cmd Command
	if err := json.Unmarshal(l.Data, &cmd); err != nil {
		log.Error("failed command unmarshal", "error", err)
		return nil
	}

	ctx := context.Background()
	switch cmd.Action {
	case "set":
		return f.localSet(ctx, cmd.Key, cmd.Value)
	case "delete":
		return f.localDelete(ctx, cmd.Key)
	default:
		log.Error("unknown command", "command", cmd, "log", l)
	}

	return nil
}
In our implementation, we are ignoring the ApplyFuture functionality. Instead we are just parsing out the action we need to perform on the local data, and then running that action on the local data store, which we will implement below.
Snapshot needs to return a snapshot of the FSM. Ours is currently incredibly simple, just storing the data that is in our local datastore. To make it more powerful, we could include a history of logs seen or something, but for now, this works. It is pretty simple code - it just gets the data and shoves it in a variable
func (f *fsm) Snapshot() (raft.FSMSnapshot, error) {
	log.Info("fsm.Snapshot called")
	data, err := f.loadData(context.Background())
	if err != nil {
		return nil, err
	}

	encodedData, err := encode(data)
	if err != nil {
		return nil, err
	}
	return &fsmSnapshot{data: encodedData}, nil
}
Restore is just the inverse of Snapshot . It pulls the data out of an io pipe, and writes it to disk.
func (f *fsm) Restore(old io.ReadCloser) error {
	log.Info("fs.Restore called")
	b, err := ioutil.ReadAll(old)
	if err != nil {
		return err
	}

	data, err := decode(b)
	if err != nil {
		return err
	}

	return f.saveData(context.Background(), data)
}
Now we need to implement our local functions. These should look very similar to functions from the beginning of our key-value server in Chapter 2. They load data, modify it, and then save it.
func (f *fsm) localSet(ctx context.Context, key, value string) error {
	data, err := f.loadData(ctx)
	if err != nil {
		return err
	}

	data[key] = value

	return f.saveData(ctx, data)
}
func (f *fsm) localGet(ctx context.Context, key string) (string, error) {
	data, err := f.loadData(ctx)
	if err != nil {
		return "", fmt.Errorf("load: %w", err)
	}

	return data[key], nil
}
func (f *fsm) localDelete(ctx context.Context, key string) error {
	data, err := f.loadData(ctx)
	if err != nil {
		return err
	}

	delete(data, key)

	return f.saveData(ctx, data)
}
Our loadData and saveData functions are quite different though. Go is multi-threaded so we need to make sure only one thread is accessing our state file at a time. If you use an ACID compliant database (like we do in future chapters), then you are freed from this concern. But here, we decided to implement it ourselves. We’re using a file lock library to prevent causing bugs in weird edge cases.
func (f *fsm) loadData(ctx context.Context) (map[string]string, error) {
	empty := map[string]string{}
	if f.lock == nil {
		f.lock = flock.New(f.dataFile)
	}
	defer f.lock.Close()

	locked, err := f.lock.TryLockContext(ctx, time.Millisecond)
	if err != nil {
		return empty, fmt.Errorf("trylock: %w", err)
	}

	if locked {
		// check if the file exists and create it if it is missing.
		if _, err := os.Stat(f.dataFile); os.IsNotExist(err) {
			emptyData, err := encode(map[string]string{})
			if err != nil {
				return empty, fmt.Errorf("encode: %w", err)
			}

			if err := ioutil.WriteFile(f.dataFile, emptyData, 0644); err != nil {
				return empty, fmt.Errorf("write: %w", err)
			}
		}

		content, err := ioutil.ReadFile(f.dataFile)
		if err != nil {
			return empty, fmt.Errorf("read file: %w", err)
		}

		if err := f.lock.Unlock(); err != nil {
			return empty, fmt.Errorf("unlock: %w", err)
		}

		return decode(content)
	}

	return empty, fmt.Errorf("couldn't get lock")
}
func (f *fsm) saveData(ctx context.Context, data map[string]string) error {
	encodedData, err := encode(data)
	if err != nil {
		return err
	}

	if f.lock == nil {
		f.lock = flock.New(f.dataFile)
	}
	defer f.lock.Close()

	locked, err := f.lock.TryLockContext(ctx, time.Millisecond)
	if err != nil {
		return err
	}

	if locked {
		if err := ioutil.WriteFile(f.dataFile, encodedData, 0644); err != nil {
			return err
		}

		if err := f.lock.Unlock(); err != nil {
			return err
		}

		return nil
	}

	return fmt.Errorf("couldn't get lock")
}
Both of our functions have a similar block (which could be abstracted if you wanted). This block makes sure a lock has been initialized, and then tries to get the lock.
if f.lock == nil {
  f.lock = flock.New(f.dataFile)
}
defer f.lock.Close()

locked, err := f.lock.TryLockContext(ctx, time.Millisecond)
if err != nil {
  return err
}

if locked {
TryLockContext tries to get the lock every millisecond. Once it has the lock, locked is set to true. We then actually work with the file, writing it or accessing it. We then call Unlock so others can use it. With load and save, our FSM is almost fully complete!
To finish out our FSM implementation, we need to implement the FSMSnapshot interface.
Our first function is Persist . In this case, we are given a io.WriterCloser , ie a variable we can write data into, that might be backed by a file or something. We shove the data that we filled our snapshot with in the FSM’s Snapshot command. Because our Persist is simple, we aren’t doing anything with the Release function. If Persist was more complicated, we could do more advanced things there.
func (s *fsmSnapshot) Persist(sink raft.SnapshotSink) error {
	log.Info("fsmSnapshot.Persist called")
	if _, err := sink.Write(s.data); err != nil {
		return err
	}
	defer sink.Close()

	return nil
}
func (s *fsmSnapshot) Release() {
	log.Info("fsmSnapsnot.Release called")
}
Finally, our encode and decode functions. They are the same as earlier in the book but are pasted here just to remind you what they do.
func encode(data map[string]string) ([]byte, error) {
	encodedData := map[string]string{}
	for k, v := range data {
		ek := base64.URLEncoding.EncodeToString([]byte(k))
		ev := base64.URLEncoding.EncodeToString([]byte(v))
		encodedData[ek] = ev
	}

	return json.Marshal(encodedData)
}
func decode(data []byte) (map[string]string, error) {
	var jsonData map[string]string
	if string(data) != "" {
		if err := json.Unmarshal(data, &jsonData); err != nil {
			return nil, fmt.Errorf("decode %q: %w", data, err)
		}
	}

	returnData := map[string]string{}
	for k, v := range jsonData {
		dk, err := base64.URLEncoding.DecodeString(k)
		if err != nil {
			return nil, fmt.Errorf("key decode: %w", err)
		}

		dv, err := base64.URLEncoding.DecodeString(v)
		if err != nil {
			return nil, fmt.Errorf("value decode: %w", err)
		}

		returnData[string(dk)] = string(dv)
	}

	return returnData, nil
}
Once we have our fsm built, we can call it from simple handlers:
// Set sets a value for a key.
func (cfg *Config) Set(ctx context.Context, key, value string) error {
	if cfg.raft.State() != raft.Leader {
		return fmt.Errorf("not leader")
	}

	cmd, err := json.Marshal(Command{Action: "set", Key: key, Value: value})
	if err != nil {
		return fmt.Errorf("marshaling command: %w", err)
	}

	l := cfg.raft.Apply(cmd, time.Minute)
	return l.Error()
}
Note how we are defining the Action here - it is just an arbitrary string. A better tact would be to make these constants. We haven’t, but there’s no reason not to. But in case you thought in our Apply function we were operating on some magical assumptions, we aren’t. We are just using the assumptions that we’re defining here. These strings could be (and probably should be) constants stored in the package and used by both functions.
// Get gets the value for a key.
func (cfg *Config) Get(ctx context.Context, key string) (string, error) {
	return cfg.fsm.localGet(ctx, key)
}
// Delete removes a key and its value from the store.
func (cfg *Config) Delete(ctx context.Context, key string) error {
	if cfg.raft.State() != raft.Leader {
		return fmt.Errorf("not leader")
	}

	cmd, err := json.Marshal(Command{Action: "delete", Key: key})
	if err != nil {
		return fmt.Errorf("marshaling command: %w", err)
	}

	l := cfg.raft.Apply(cmd, time.Minute)
	return l.Error()
}
And that’s it - our store library is done! We’ve made sure to comment on all capitalized functions, types and variables, so that they’ll show up documented in our go doc or on https://godoc.org.
Testing#
Testing distributed systems is hard. There are lots of frameworks for doing this, but most are incredibly specialized, and often built for just testing one very specific distributed system. One of my favorite tools these days for testing web servers with integration tests is k6. It’s a Typescript library which lets you do all sorts of load tests and HTTP client testing.
For our service though, I wanted a simple test that I could run locally. I first wrote it in Bash. But Bash is complicated, easy to make typos in, and hard to read if you do not know shell scripting languages. As such, following Julia Evans’ fabulous article, I rewrote it in Go. Rewriting it even helped me find a bug in the code, as there was a small risk where the first set wouldn’t work.
package main

import (
	"bufio"
	"fmt"
	"io"
	"log"
	"net/http"
	"os"
	"os/exec"
	"strings"
	"time"
)

var (
	Servers = []string{"http://localhost:8080", "http://localhost:8082", "http://localhost:8084"}
)

func main() {
	if _, err := os.Stat("docker-compose.yml"); os.IsNotExist(err) {
		log.Fatal("You need to be running this in the same directory as docker-compose.yml")
	} else if err != nil {
		log.Fatal(err)
	}

	go runCommand("docker-compose", strings.Split("up --remove-orphans --force-recreate --build", " "))

	time.Sleep(3 * time.Minute)

	for _, s := range Servers {
		val := time.Now().String()
		if _, err := http.Post(fmt.Sprintf("%s/key/test", s), "application/x-www-form-urlencoded", strings.NewReader(val)); err != nil {
			log.Fatal(err)
		}

		// Now make sure we can read it everywhere.
		for _, t := range Servers {
			resp, err := http.Get(fmt.Sprintf("%s/key/test", t))
			if err != nil {
				log.Fatal(err)
			}

			body, err := io.ReadAll(resp.Body)
			if err != nil {
				log.Fatal(err)
			}

			if val != string(body) {
				log.Printf("Error on Server %s: %q != %q", t, val, string(body))
			}
		}

		time.Sleep(10 * time.Second)
	}

	// The possible values here can be seen from "docker-compose ps --services"
	go runCommand("docker-compose", strings.Split("restart kv_4", " "))
	time.Sleep(5 * time.Second)

	// Now a test with a server down
	val := "test test test"
	if _, err := http.Post(fmt.Sprintf("%s/key/test2", Servers[0]), "application/x-www-form-urlencoded", strings.NewReader(val)); err != nil {
		log.Fatal(err)
	}

	// Sleep for data to replicate
	time.Sleep(5 * time.Second)
	resp, err := http.Get(fmt.Sprintf("%s/key/test2", Servers[1]))
	if err != nil {
		log.Fatal(err)
	}

	body, err := io.ReadAll(resp.Body)
	if err != nil {
		log.Fatal(err)
	}

	if val != string(body) {
		log.Printf("Error on down test: %q != %q", val, string(body))
	}

	runCommand("docker-compose", []string{"down"})
}

func logBuffer(prefix string, in io.ReadCloser) {
	scanner := bufio.NewScanner(in)
	for scanner.Scan() {
		log.Printf("%s: %s", prefix, scanner.Text())
	}
}

func runCommand(command string, args []string) {
	cmd := exec.Command(command, args...)
	log.Printf("running %+v", cmd)

	stderr, err := cmd.StderrPipe()
	if err != nil {
		log.Fatal(err)
	}

	stdout, err := cmd.StdoutPipe()
	if err != nil {
		log.Fatal(err)
	}

	if err := cmd.Start(); err != nil {
		log.Fatal(err)
	}

	go logBuffer("stderr", stderr)
	go logBuffer("stdout", stdout)

	if err := cmd.Wait(); err != nil {
		log.Fatal(err)
	}
}
This is a pretty simple test. We use docker-compose (more on that in the next section) to spin up three copies of our code. We then send a few HTTP requests to all of the nodes to make sure they are distributing value changes.
At the end, we shutdown one node, and make sure the other two keep working.
An aside, Docker#
We have not talked much about deployment in this book, as it is mostly a topic for another book. That being said, we should walk through our Dockerfile and docker-compose.yml so you don’t think they are magic. If you want to learn more, check out the Dockerfile reference and docker compose file reference.
Docker is a tool for creating Containers using the containerd runtime. Docker interprets a Dockerfile and uses it to build a container image. Docker Compose is a tool to build multiple container images, and run them all at once, orchestrating them so they can talk together. It is often viewed as a lightweight Kubernetes.
FROM golang:1.16-alpine3.12

ENV GOPROXY="https://proxy.golang.org"
ENV GO111MODULE="on"

ENV PORT=8080
EXPOSE 8080

ENV RAFT_PORT=8081
EXPOSE 8081

WORKDIR /go/src/github.com/fullstackio/reliable-go/distributed-key-value-store

RUN apk add --no-cache git
COPY . .

RUN go build -v -o /go/bin/server .

CMD ["/go/bin/server"]
We start with the standard Alpine Go Docker image (look for images with -alpine in their name). Alpine is a lightweight Linux distribution. It is like Ubuntu, Debian or Fedora, but has less stuff installed by default. We then set a variety of environment variables, using the ENV command. To make network ports available, we use the EXPOSE command. Note that this image exposes two ports, just like our code does - one for Raft and one for our HTTP server.
We specify a WORKDIR to define the default starting directory for this container. It is not required, but I personally find it useful to embed the Go package path. Back before Go modules, this was actually required, but no longer. Now it’s just for organizing our code.
Next, we install git as it is not in the original Alpine image. Then we copy in our code, and compile it, saving the binary as /go/bin/server . Finally CMD tells docker the default command to run when this container starts.
Note that we could actually compile our binary and run it in a smaller container that just has the binary. Check out this medium article for an idea of how to make a very small Go container image.
Docker Compose#
Next let us look at our compose config.
version: "3.8"
services:
  kv_0:
    build:
      context: .
    environment:
      RAFT_LEADER: ""
      RAFT_ADDRESS: "distributed-key-value-store_kv_0_1"
    ports:
      - "8080:8080"
      - "8081:8081"
  kv_2:
    build:
      context: .
    environment:
      RAFT_LEADER: "http://distributed-key-value-store_kv_0_1:8080"
      RAFT_ADDRESS: "distributed-key-value-store_kv_2_1"
    ports:
      - "8082:8080"
      - "8083:8081"
  kv_4:
    build:
      context: .
    environment:
      RAFT_LEADER: "http://distributed-key-value-store_kv_0_1:8080"
      RAFT_ADDRESS: "distributed-key-value-store_kv_4_1"
    ports:
      - "8084:8080"
      - "8085:8081"
Each block in the services section defines a running container. The build context section says to build the container from the current directory. We then specify some environment variables, mostly just telling the binary where the leader is, and what each server’s DNS address is. We also open both of the ports on our local machine, so we can talk to it with our test binary, or any HTTP client.
Running the test
Ok! So with all of that, we can go run ./test, and we’ll see a ton of logs as the three servers spin up. First you’ll see logs for the docker containers building, and then you will start to see logs from the code. If the logs don’t make sense, you can also run docker ps in another terminal to see the containers once they are built.
$ docker ps
CONTAINER ID   IMAGE                              COMMAND            CREATED          STATUS          PORTS                                            NAMES
ed6f4b197525   distributed-key-value-store_kv_0   "/go/bin/server"   15 seconds ago   Up 10 seconds   0.0.0.0:8080-8081->8080-8081/tcp                 distributed-key-value-store_kv_0_1
f8b012e6abae   distributed-key-value-store_kv_2   "/go/bin/server"   15 seconds ago   Up 10 seconds   0.0.0.0:8082->8080/tcp, 0.0.0.0:8083->8081/tcp   distributed-key-value-store_kv_2_1
e34bc73d8550   distributed-key-value-store_kv_4   "/go/bin/server"   15 seconds ago   Up 10 seconds   0.0.0.0:8084->8080/tcp, 0.0.0.0:8085->8081/tcp   distributed-key-value-store_kv_4_1
And now you have a distributed server running on your laptop. We will leave it as an exersize to the user on how to get this running elsewhere, but with the dockerfile, it should be pretty easy!
Monitoring#
We have built a distributed system. We have tested it. We can just launch it into production and assume it works! Right?
Sadly, no.
Once our service is running, it is akin to Schrödinger’s cat. The service is neither working nor broken while it’s running if we aren’t monitoring it. In our analogy, the cat is our service, the place it’s running (the cloud, your laptop, etc.) is the box, and the users are our radioactive isotope. For us to know whether our “cat” is alive or dead, we need to look at it according to Schrödinger. If we assume we care about our “cat,” we can either open the box and look at it, or find some other proof the “cat” is alive (listen for meowing, purring, smell something, etc). Sorry, this metaphor is getting tired. Hopefully you get the idea: we want to know if our cat is alive, and we need a way to verify that at any point in time.
Users will be sending requests to our service. Each request is an event. For each event, there are a handful of states it can be in: in progress, success or failure . While our users care about each event they send (their special precious little requests), we care more about all requests and all users, or all events for all time. How do we know at any point in time if our users are happy? If a user’s request fails, do they care? Can they retry? How many of our events have been successful? What level of event success means our service is healthy?
In this chapter we’ll try to help you understand how to think about this, as well as how to instrument the key-value server.
Two types of monitoring#
Observability is a popular term for the overarching work of making sure you can tell what is going on with your service. In the world of observability, there are two ways to observe your system: black box monitoring and white box monitoring . Black box monitoring is the idea that you have no control over the system, and so you examine it from the outside. White box monitoring is the idea that you have full control of the system, and you can instrument internal pieces with metrics, logs and traces to understand how things are working.
Black box monitoring#
As we said, black box monitoring is examining from the outside. It is often also called synthetic monitoring or behavioral testing . We are going to generate a synthetic event, send it through our system and see what happens. This differs from the integration testing that we discussed in Chapter 3 because we are sending our synthetic event to our production environment, instead of a test environment. That being said, this is essentially testing, because we have a predefined synthetic input, and we will have a test that will validate the output.
Synthetic events for web systems tend to be HTTP requests, which means the easiest synthetic event generator in this case is the command line application curl . Curl has been around since 1997, and is an essential tool. The command flags I use most frequently are -v , -s , and -L . Together you can watch how a request works.
$ curl -svL http://google.com
-
-sis for silent, and it hides any progress bars. -
-vis for verbose, and it outputs the headers sent and received to STDERR. -
-Lis for location, and it has curl follow any HTTP redirects that are returned.
So if your server is running locally on port 8080, you could call curl -svL localhost:8080 > /dev/null 2>&1 | grep HTTP every second and watch the responses come in. For reference, > /dev/null 2>&1 will ignore any errors curl would otherwise output, and | grep HTTP will only show us output lines that include the string HTTP .
> GET / HTTP/1.1
 < HTTP/1.1 200 OK
This would, of course, get boring. So instead you could add the watch command, which runs commands every n seconds.
$ watch -d -n 1 "curl -svL localhost:8080 > /dev/null"
The -d flag tells watch to highlight any differences in the output of the command and the -n 1 flag means run the command every second. So every second we will see the changes between the current run of the command and the previous run. We remove the 2>&1 | grep HTTP from above because redirecting stderr into stdout (that’s what 2>&1 does) messes with watch.
But this still requires someone to stare at command output, which is not ideal. Instead let us use something prebuilt and automated which alerts when things change.
Cloudprober#
Cloudprober is an open-source project from Google that focuses on regularly running checks against targets to determine if they are healthy, and then returning that data to your preferred monitoring service.
Cloudprober can output its results to a variety of monitoring programs, and can send requests using a variety of protocols. Each “probe” is defined as a combination of type, interval, targets , and validators . To define a new probe:
- choose a type , such as HTTP
- define a set of targets , like localhost:8080
- decide the intervals - how frequently you want to run your test (for example every 1000 ms)
- write a validation that determines if your request was good (for example, response status code equals 200)
You can read the documentation for all of the different functionality, but the idea here is instead of doing something manually, we have a service that regularly sends requests and validates the responses.
probe {
  name: "localhost"
  type: HTTP
  targets {
    host_names: "localhost:8080"
  }
  interval_msec: 1000  # 1s
  timeout_msec: 500    # 0.5s
}
Here is a basic config for Cloudprober which sends a request to http://localhost:8080 every second. Right now this won’t alert or upload the data it records anywhere. We’ll talk in a bit about picking a monitoring service, in the section on white box monitoring, but if you were to pick Google Cloud Monitoring, you’d add something like this to your config:
surfacer {
  type: STACKDRIVER
}
This will add a lot of metrics with the prefix custom.googleapis.com/cloudprober/http/ to Cloud Monitoring in the project you have installed this service in, or that you have set as the default project with the gcloud command.
Hosted service options#
Running health checks on a schedule is a common feature that many companies offer for free or cheaply. Cloudprober lets you run all sorts of arbitrary checks, but if you just need HTTP-based checks, then there are many options!
- Pingdom - An old standby that has been around forever. They used to have a very generous free plan. These days they charge, but have more features.
- Google Cloud Monitoring Uptime Checks - Free for Google Cloud Platform customers, but limits checks to once a minute.
- Apex Ping - A small company, but with a comprehensive feature suite similar to Pingdom’s.
- Datadog Uptime Checks - Datadog is a large monitoring company offering configurable synthetic uptime checks.
- and many more!
White box monitoring#
White box monitoring, sometimes called internal-state, glass box or transparent monitoring , is the inverse of black box monitoring. That is to say you monitor things by looking at the internals of the system. This happens by instrumenting business logic of system internals. The most recognizable form of intrumentation is logging, but could include any other method of internal metrics collection. White box monitoring metric examples include requests per second, CPU usage, number of widgets bought, or anything else you think you could turn into an event.
White box monitoring is great because it lets you instrument just about everything. Because it is so powerful, it can be used in lots of ways, and there lots of services that let you do this type of monitoring. Some are open-source, others proprietary and some even work together. Here’s an incredibly incomplete list of popular services:
- Prometheus
- Statsd
- Grafana
- Datadog
- Google Cloud Monitoring (aka Stackdriver)
- Amazon Web Services Cloudwatch
- Microsoft Azure Monitor
- Influx TICK Stack
- Nagios
- and there are many, many more
An unpopular opinion is that it doesn’t really matter which one you pick. They all have pros and cons. The only piece of advice we can offer in this area is to be consistent. Integrating with one monitoring system is a lot of work - integrating with many of them is much harder.
OpenTelemetry#
OpenTelemetry (formerly OpenCensus) is a library which we will use to instrument our code. We’ve chosen it because it integrates with many different services easily, and provides a lot of white box monitoring for free.
Note that reading the docs and examples for this library is probably a more accurate way to learn this, as this is a fast-evolving library. But we will try and give some high-level examples to help you understand.
How OpenTelemetry works is:
- You define how you’ll be exporting your metric.
- You define a global variable that defines the metric you want to increment.
- You insert data into your metric.
For our first example, we will just export our data to stdout. This is great for debugging, but is not great in production. In production you want to use a monitoring service like we mentioned above to have less latency from metric insert until it shows up. If you were to use stdout as your monitoring service in production, you would need to have a service read your logs or wherever you were writing stdout to, process and parse each new line, and then display them. With monitoring services, you just need to call the insert (which OpenTelemetry would do for you) and then the service will save it in an optimized way to make displaying and alerting off of that data available quickly.
import (
  "log"

  "go.opentelemetry.io/otel/exporters/stdout"
)

func main() {
  exportOpts := []stdout.Option{
    stdout.WithPrettyPrint(),
  }

  pusher, err := stdout.InstallNewPipeline(exportOpts, nil)
  if err != nil {
    log.Fatal("Could not initialize stdout exporter:", err)
  }
  defer pusher.Stop()
}
Now that the exporter is configured, and you run the code… nothing happens! That’s fine - it’s because we haven’t created a metric or incremented it.
meter := global.Meter("example.com/foo")

	cnt, err := meter.NewInt64Counter(
		"count",
		metric.WithDescription("An arbitrary counter."))
	if err != nil {
		log.Fatalf("failed to create metric: %v", err)
In this code, we are getting the global Meter. The Meter is essentially a factory for metrics. Once we have the meter, we are creating a new counter (there are lots of types of counters, this is just one).
We can then easily increment that counter, whenever we want:
cnt.Add(ctx, 1)
The Add function takes labels as well if you want to add them. Labels allow for more future filtering. For example, you could add details about the request or the service to the counter.
If we add an infinite loop to our program, we can count to infinity.
for {
		cnt.Add(ctx, 1)
		time.Sleep(time.Second)
	}
If you let that run for a bit, you might expect it to just output the number of seconds that ran. That’s not quite correct.
$ go run .
[
	{
		"Name": "count{instrumentation.name=example.com/foo}",
		"Sum": 11
	}
]
[
	{
		"Name": "count{instrumentation.name=example.com/foo}",
		"Sum": 10
	}
]
[
	{
		"Name": "count{instrumentation.name=example.com/foo}",
		"Sum": 10
	}
]
Instead, every ten seconds, our exporter will export all of the metrics and their values from the last ten seconds. The first value is 11, because we had one Add call before the for loop. If this confuses you, let’s talk a bit about how metrics often work.
Metric philosophy#
Time series are a list of values at a time. In our for loop example, we were essentially writing the number 1 every second to our time series “database”. Then when we displayed it to the user (us), we sampled it down to every 10 seconds. In our previous example, because we chose an Int64Counter , it samples by adding all of the values together.
The reason for this is it gets expensive to store data at per-second granularities. Many systems make this configurable, but often systems (especially hosted time series databases and monitoring platforms) won’t store data at granularities more refined than one minute. This is fine, because for most metrics you want to see the rate of change, not the actual value.
For instance, a common metric for web servers is requests per second. This isn’t the total number of requests at any second, but rather the rate of requests. So if there is an entry of 60 requests stored in the database every minute, 60 requests / 60 seconds equals 1 request per second at that minute.
Some metric services let you define pre-computations. These are saved equations that are calculated against your metrics. They can be helpful in some systems to define queries that run regularly. Think of them like an index on a database table. You can define rate calculations and things so when you alert on them they are fast and retained for a long time. See your metric service documentation for more.
Choosing what to monitor is a bit of an art, which is why this section is titled “philosophy”. In web servers, the most common metrics are around requests. How many HTTP requests did this server get? How many things have been bought? How many users have checked in recently? However, anything that can be counted can be a metric. The best metrics are things that change often. If something only happens once a day, it is probably not worth making it a metric.
When deciding where you need metrics think about the following things:
- what common actions users take
- where common failure points are
- when dependencies are called
These three areas are all great places to put metrics, because they happen often, and dramatic changes often are good points to look at when debugging.
Metrics can also have labels. This lets a single metric tell a deeper story. For example, if you have two metrics, requests_to_dependency and responses_from_dependency , you could increment them for all dependencies, but add a label called dependency on both where you name who you are talking to. And in the response, you can have a label called status_code to figure out if one dependency is returning errors.
When choosing labels, be careful to not pick something with too much cardinality. That is to say labels should have a small and finite number of possible values. A bad metric label would be user_agent . This is because user agents are an arbitrary string, and there are hundreds of millions of different values out there. Meanwhile, status_code is a good label, because there are only 999 possible values, and less than ten seen regularly.
If you have very complex, highly divergent or freeform data to store, do not shove it in your time series database! Instead use logging.
Logging#
Logging is not the process of cutting down trees, but rather of writing out lines of text with a date and time connected to them, so you can see what your process is doing. Logs let you leave freeform messages as you go. Logs are often considered the scalable way of doing “print statement debugging”. There are lots of similarities between the two. Print statements let you write messages out to stdout so you can see how your services is doing.
fmt.Printf("wrote %d rows to the db\n", len(rows))
Logs let you add additional information to your print statements, and do so in a consistent manner. The standard library has a simple log library to start with, so you can turn the previous print statement into:
log.Printf("wrote %d rows to the db", len(rows))
This will output:
2009/11/10 23:00:00 wrote 10 rows to the db
Note the added current datetime and the lack of a need for a newline! So much better.
But logging’s real power comes when you can add much more data to your log output using a more sophisticated logging library.
Popular logging libraries in Go#
Each of these libraries has a different syntax, but they all let you do three extra exciting things:
- define the output of your log lines
- add log levels
- add extra log metadata
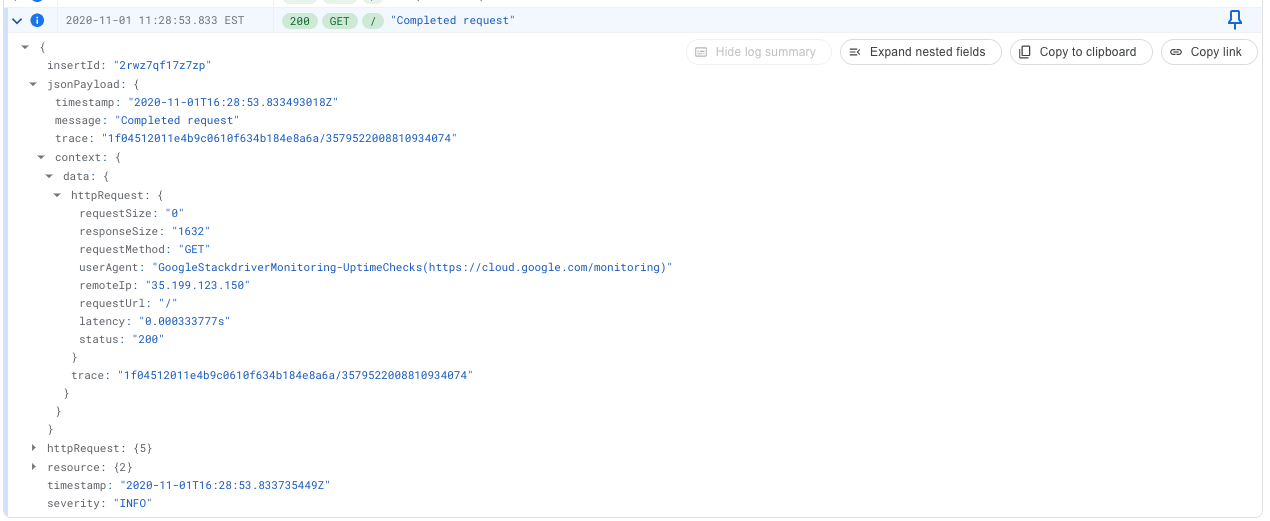
These are important because they let you filter your logs when you are debugging your service. This extra data added to a log line is called structured logging. This is because the output of the log line is in a consistent, machine readable format. For instance, Google Cloud Logging lets you output your log lines as JSON or protobuffers. It then displays that metadata in a nice way.
With structure in your logs, you can quickly filter for a field, create a graph of a field over time, or apply a regular expression over that field. For example, you could use it to easily find what percentage of your requests come from bots by applying a regular expression to the user agent.
When you have the ability to store so much data in a log field, and it does not have the downsides of metrics (cardinality limits being the most frustrating one), why not use logs as your only monitoring source? The answer is speed. While logs can be written quickly with lots of data, you sacrifice retrieval speeds. While metric systems often take seconds to get the most recent data, log processing systems often have large delays before the data can be retrieved. A common type of delay is a log not being visible for filtering and review until five minutes after it was emitted from the service.
If you want alerts on the last five minutes of data, logs quickly become unusable. That being said, logs are amazing for long-term analysis. Finding all requests that were affected by a bug or to see how sales have changed over the past year are both great things logs can assist with.
In distributed systems, logs can get complicated. How do you connect a log in one system to one in another? The answer is tracing.
Tracing#
Tracing adds an ID to a request so you can see how it moves through a system. There are two standards that most tracing systems follow: the W3C’s Trace Context and OpenTracing. These were preceded by two popular systems called Zipkin and Dapper.
The idea here is if you have IDs on your requests, you can see how data is moving through a distributed system. For example a user makes a request to / which goes through a load balancer, then hits an application server, and then hits a Postgres database. Being able to see the options the user requested on / and how that affected the query to the database is incredibly useful for debugging. The goal here is not to see how an individual user interacts with our system (many would consider that a violation of privacy and unethical) but rather to group classes of requests together and see how they work. You do this by sampling requests, obfuscating any information that might be used to identify a user.
How to implement tracing#
OpenTelemetry actually gives us tracing information as well as metric information. Many cloud providers also have tracing products and work with the common tracing standards.
To do tracing, you’ll need two things: client instrumentation and a backend. The backend stores the traces, and are what cloud providers sell. The instrumentation will mostly be done by you, but some hosted products like load balancers regularly have tracing instrumentation done for you.
- Google Cloud Platform has a tracing product called Cloud Trace, and adds trace information to all requests that pass through their L7 Load Balancer as well as a few of their other hosting products.
- Amazon Web Services has a tracing product called X-Ray, and adds trace information to a variety of their products.
- Microsoft Azure has a tracing product called Application Insights.
- Other companies also sell hosted tracing products, including Datadog, Honeycomb and others.
- You can also host your own tracing backend with Jaeger.
The following sets up a basic OpenTelemetry tracing instrumentation, which writes the traces to standard out.
exporter, err := stdout.NewExporter(stdout.WithPrettyPrint()) if err != nil { log.Fatal(err) } ctx := context.Background() r, err := resource.New(ctx, resource.WithAttributes(semconv.ServiceNameKey.String(“HelloWorld”))) if err != nil { log.Fatal(err) } tp := sdktrace.NewTracerProvider(sdktrace.WithConfig(sdktrace.Config{DefaultSampler: sdktrace.AlwaysSample()}), sdktrace.WithSyncer(exporter),
We then use a sub-library called otelhttp to wrap our simple HTTP server with tracing.
if err != nil { log.Fatal(err) } otel.SetTracerProvider(tp) otel.SetTextMapPropagator(propagation.NewCompositeTextMapPropagator(propagation.TraceContext{}, propagation.Baggage{}))
This will now include trace data for all requests we receive. If we wanted to wrap our HTTP client with tracing data, we could do that as well using otelhttp .
http.Client{ Transport: otelhttp.NewTransport(http.DefaultTransport), }
See the docs to learn more.
Now that we have all of this monitoring data, we need to alert on it.
Alerting#
There is a lot to be said about alerting, so we will keep this brief. Alerting is the concept of telling you about problems in your system. The most basic kind of alerting is done by setting a threshold on a metric. You set something like “when metric X is about Y for Z minutes, alert me”.
Every monitoring platform has a different way of defining alerts, so we won’t go into that. There’s also been a lot written on how to design good alerts.
Some of that writing can be found at:
- Rob Ewaschuk’s Philosophy on Alerting
- Google SRE Book on Alerting
- SRE fundamentals: SLIs, SLAs and SLOs
- Implementing Service Level Objectives: A Practical Guide to SLIs, SLOs, and Error Budgets
Once you have defined your alerts, you’ll want to send them somewhere. That can be a text message, an email, a chat app, or an alerting service. Alerting services let you notify lots of people, define rotations (time periods where people are working) or more complex notification rules. Some to investigate include:
Further reading#
A canary deployment server#
Up to now we’ve talked mostly about key-value servers - making one, testing it, and turning it into a distributed system. Now it is time to talk about something every company does: deploy code.
Companies of every size deploy code. Some do it once a week, some do it as soon as the code is ready. Regardless of how often they deploy, one valuable strategy when deploying is not to change everything all at once . A great way to do this is with canary deployments.
Canary deployments are when new code is deployed to a small subset of users to determine that the code changes work as expected. Once you have determined the success or failure of the changes, you can make them live to all users, or remove them entirely as desired.
The appropriate method by which all of this happens is determined by how your application works. As this is a book about web servers, we are going to assume that you’re making changes to some variety of server code. A great way to do canary deploys with web servers is to use a load balancer to send a small percentage of traffic to your new servers.
In this chapter, we will build a small load balancer, starting with a very simple random-per-request load balancing mechanism, and building our way up to round-robin with sticky sessions. At the end, we will allow our load balancer to receive configuration from the key-value server we’ve previously written, so we can scale our load balancers and won’t ever need to turn off traffic to our application.
Wait, what’s a load balancer?#
A load balancer is a web server that sits in front of your application, relaying requests it receives to multiple backend servers. It does this by acting as a reverse proxy, where it receives a request and holds a connection to that request open while it relays it to a backend, and finally returns that result to the original request.
Load balancers allow you to scale your backend by balancing requests between multiple servers that all serve the same purpose. It also lets you direct traffic by determining where each individual request should be routed to. We’re going to use the latter capability to create our canary deployment server.
If you want to read more, Wikipedia has an indepth page on load balancers.
What aren’t we doing?#
Before we get started, we should make sure we’re clear about what we aren’t doing. This will inform choices that we make further down the line, and ensure our load balancer does what we need it to without being more complicated than necessary.
We’re not:
- Writing our own reverse proxy - this is relatively complicated. If you’re interested, look at the Go standard library methods which we’ll be using.
- Allowing more than two backends - normally there would be a large number of servers, with a canary being a small subset. In this case, we only need our existing server and our new code on the canary host.
- Running health checks - load balancers generally ensure the servers they are talking to are healthy, but because we’re only working with two, we’ll assume they’re up and running fine.
- Tracing - this can be an important aspect of understanding the health of the canary deployment, especially when things go wrong, but handling it distracts from our primary goal of setting up the canary deployment server.
Other considerations would also complicate our canary deployment server. For production systems they would all be very important, but for us they would be a distraction from the core of the issue.
So we’re also not:
- Buffering or streaming - requests can be very large, and handling them is important, but for simplicity’s sake we’ll omit those kinds of capabilities for now.
- Conditional routing - some systems allow you to inspect aspects of the request, such as the PATH. That can be very useful, but isn’t really essential, so we’ll skip it for the time being.
- Rate-limiting or backpressure - these are important concepts to prevent the overloading of systems, however they’re typically handled by the systems themselves, so are out of scope for our canary deployment server.
- TLS - some variety of transport encryption protocol is important for every web service these days. It is frequently handled at the load balancer level, but makes things more difficult for us at the moment. If you do want to check out something similar, see these projects:
So what will we be doing?#
We are going to be building a load balancer with two main options for load balancing type: random-per-request and round robin . We will also allow for the option of sticky sessions, and use a server for configuration and to allow changes while keeping the load balancer running.
So - let’s get started!
A basic random-per-request load balancer#
Let’s go through the pieces necessary to create our random-per-request load balancer.
A quick note about the code in this chapter: Because we won’t be using any packages outside of the standard library, programs listed here won’t include the package main line nor the imports. Luckily, the goimports tool will allow you to automatically add those sections to your code.
The first thing we will need is someplace to store our state. We have two servers we will be pointing at, and these servers’ structs will both be storing their reverse proxy information.
We’ll also need the ratio of how many requests we want to go to one versus the other. And because we are choosing randomly, we can include our random seed in all of this state.
So create a new directory for our canary deployment server, and then we can start our load_balancer.go file like this.
func main() { // We’ll fill this in later. } // Server defines settings for this specific server. type Server struct { proxy *httputil.ReverseProxy } // NewServer creates a Server reverse proxy for the given URL. func NewServer(sURL string) (Server, error) { serverURL, err := url.Parse(sURL) if err != nil { return Server{}, err } return Server{proxy: httputil.NewSingleHostReverseProxy(serverURL)}, nil } // LoadBalancer is a collection of Servers. type LoadBalancer struct { servers []Server rng *rand.Rand ratio int // Positive int less than or equal to 10 }
func main() {
	// We'll fill this in later.
}

// Server defines settings for this specific server.
type Server struct {
	proxy *httputil.ReverseProxy
}

// NewServer creates a Server reverse proxy for the given URL.
func NewServer(sURL string) (Server, error) {
	serverURL, err := url.Parse(sURL)
	if err != nil {
		return Server{}, err
	}

	return Server{proxy: httputil.NewSingleHostReverseProxy(serverURL)}, nil
}

// LoadBalancer is a collection of Servers.
type LoadBalancer struct {
	servers []Server
	rng     *rand.Rand
	ratio   int // Positive int less than or equal to 10
}
NewServer is a helper method that’ll make it easier for us to set up backends in the future.
This code notably uses httputil , which is in the "net/http/httputil" standard library package. We’re using this so we don’t have to write our own reverse proxy. Even though that might be fun, there are a number of RFCs (RFC 7230 and RFC 2616) that determine what headers need to be stripped from the request, among other things that we probably want to let someone else handle for us. If you want to see what you’re missing, check out the httputil.ServeHTTP method from the Go standard library.
Now that we have our state handled, we need to determine how to choose the right server to send each request to. Since we’ll assume we always have two servers available, we only have to choose a random number, see if it is greater than our ratio, and use that to determine what server to send it to. It ends up looking like this.
// NextServer generates a random integer to determine if the 1st or 2nd Server should be proxied to.
// When the random integer is greater or equal to the ratio, proxy the request to the 2nd Server.
//
// We always assume there are two Servers.
func (lb *LoadBalancer) NextServer() *Server {
	index := 0
	if lb.rng.Intn(10) >= lb.ratio {
		index = 1
	}

	return lb.servers[index]
}
With that out of the way, actually handling the request becomes easy. We choose a server, and then we reverse proxy the request to it.
// ProxyRequest forwards the request to the Server.
func (lb *LoadBalancer) ProxyRequest(w http.ResponseWriter, r *http.Request) {
	server := lb.NextServer()
	server.proxy.ServeHTTP(w, r)
}
Now that we have all the pieces, we can glue them together with a main function. It has flags for the URLs of our servers which are used as parameters to the NewServer function to create our reverse proxies. Then we can create our load balancer with the servers and start it up.
That gives us this:
func main() {
	var (
		s1    = flag.String("s1", "http://localhost:8080/", "first server")
		s2    = flag.String("s2", "http://localhost:8081/", "second server")
		ratio = flag.Uint("ratio", 5, "How many requests out of 10 should go to server 1, default 5")
	)
	flag.Parse()

	server1, err := NewServer(*s1)
	if err != nil {
		log.Fatalf("Couldn't setup server1: %s", err)
	}
	server2, err := NewServer(*s2)
	if err != nil {
		log.Fatalf("Couldn't setup server2: %s", err)
	}

	loadBalancer := LoadBalancer{
		servers: []Server{server1, server2},
		rng:     rand.New(rand.NewSource(time.Now().UnixNano())),
		ratio:   int(*ratio),
	}

	server := &http.Server{
		Addr:    ":8888",
		Handler: http.HandlerFunc(loadBalancer.ProxyRequest),
	}

	log.Fatal(server.ListenAndServe())
}
And that’s it!
Making sure it works#
Now that we have the code written, we should make sure it works. To do that, we need to have two servers to test with, and we’ll need to start our load balancer, and then send the requests.
Let’s create a new file in a different directory for this test, since it will need its own main function to run it all. Call the directory test , and the file run_lb.go .
Start by creating the server functions we need to test with in our run_lb.go file.
func main() {
	// TODO
}

// SimpleServer sets up a simple server that always returns a message on the specified port.
func SimpleServer(port, message string) {
	serveMux := http.NewServeMux()
	serveMux.HandleFunc("/", func(w http.ResponseWriter, r *http.Request) {
		w.Header().Set("Content-Type", "text/plain")
		fmt.Fprintf(w, message+"\n")
	})

	log.Fatalln(http.ListenAndServe(":"+port, serveMux))
}
These servers are very simple. They accept any request to any path and return whatever message we set them up with.
For convenience, this method will also run the server. However, that means we will need to run this method in a Go routine, by prepending go to it, otherwise we would never get past the server starting up.
Now that the servers are made, we will need to run our load balancer. We can do that with the handy exec package, which will allow us to use shell commands, including go build . So we can build our load balancer binary, wait for that to finish, and then run it.
We will also need to run our load balancer asynchronously, because we still need to send requests to it. It will take some time for the load balancer to start up, so we’ll throw a sleep in there too.
Setting up our servers and load balancer looks like this.
func main() {
	buildCmd := exec.Command("go", "build", "-o", "load_balancer", "load_balancer.go")
	if err := buildCmd.Start(); err != nil {
		log.Fatal(err)
	}
	buildCmd.Wait()

	go SimpleServer("8080", "Port 8080 server!")
	go SimpleServer("8081", "Port 8081 server!")

	ctx, cancel := context.WithTimeout(context.Background(), 4*time.Second)
	lbCmd := exec.CommandContext(ctx, "./load_balancer", "-ratio", "5")
	err := lbCmd.Start()
	if err != nil {
		log.Fatal(err)
	}

	time.Sleep(2 * time.Second)

	// We're going to make requests here

	cancel()
	lbCmd.Wait()
}
We can use the http standard library to issue a number of Get requests to our load balancer and see what the results are. Using a for loop, we’ll make our Get request, read the body and print the result, error or otherwise. This will happen after our setup and sleep to ensure the load balancer has started, and once it is done our cancel will let the main method close. This rounds out our load balancer test.
for i := 0; i < 10; i++ {
	resp, err := http.Get("http://localhost:8888")
	if err != nil {
		fmt.Println(err)
		continue
	}

	body, err := io.ReadAll(resp.Body)
	if err != nil {
		fmt.Println("error: ", err)
	} else {
		fmt.Print(string(body))
	}
	resp.Body.Close()
}

cancel()
lbCmd.Wait()
We can give it a trial run with go run test/run_lb.go and see it hit our servers. You can also edit the test to adjust the ratio - if you set it to "0" or "10" , you’ll see that it only ever hits one server during its run.
Sticky sessions#
Next we’re going to look at an essential feature for a canary deployment server - sticky sessions.
Sticky sessions means that the load balancer can send any future requests coming after an initial request to the same server as the initial request . This is an important feature to have if we’re ever doing a canary deployment where we are adding new functionality. The primary issue in that case would be that a user could connect to one server and use the new feature, but when they make a second request related to the new feature, get the second server. The second server doesn’t know about the new feature, and the user encounters an error. Sticky sessions lets us prevent that from happening.
A nice simple way to create sticky sessions is with browser cookies. The general idea is to receive a request and check for the presence of a specific cookie. If the cookie exists, we can use that information to route the request to the correct server. But if the cookie doesn’t exist, we’ll allocate the server in the normal fashion, and include the appropriate cookie in our response, so any subsequent requests will be routed to the same server.
It should be noted that using browser cookies for sticky sessions definitely has some issues. For example, a user could clear their cookies or be using a client that doesn’t return cookies on the next request. But it is significantly less complicated than other methods of identifying users such as using their IP or browser fingerprinting.
With those considerations in mind, let’s add sticky sessions!
First we update our LoadBalancer definition in the load_balancer file to include the sticky sessions option.
// LoadBalancer is a collection of Servers.
type LoadBalancer struct {
	servers        []Server
	rng            *rand.Rand
	ratio          int
	stickySessions bool
}
Then we need to adjust our ProxyRequest method. When sticky sessions is enabled, it will need to read potential cookie information and set cookies on requests. Go has built in support for cookie information, so once we decide on a name and value for our cookies, implementing that won’t be too difficult.
We’ve chosen the name "server" for the cookie, and the value will be the index at which the server is stored in our load balancer. Because cookies are always string information, the index will have to be converted from string to integer when reading cookies, but when writing them we can just write them directly as strings.
Our previously lovely and small ProxyRequest method is now a bit larger, and looks like this:
// ProxyRequest forwards the request to the Server.
func (lb *LoadBalancer) ProxyRequest(w http.ResponseWriter, r *http.Request) {
	var server Server
	cookie, _ := r.Cookie("server")

	if lb.stickySessions && cookie != nil {
		index, err := strconv.Atoi(cookie.Value)
		if err == nil && index >= 0 && index < len(lb.servers) {
			server = lb.servers[index]
		}
	}

	// If we don't have a server yet, get the next server.
	if (Server{} == server) {
		server = lb.NextServer()
	}

	if lb.stickySessions {
		index := "0"
		if server == lb.servers[1] {
			index = "1"
		}
		setCookie := &http.Cookie{Name: "server", Value: index}
		http.SetCookie(w, setCookie)
	}

	server.proxy.ServeHTTP(w, r)
}
Take a look at the Cookie method that exists on the http.Request that we receive. It will return a pointer to a cookie with the given name, or nil and an error if the cookie doesn’t exist.
- We won’t check if the cookie exists here, but just see if we have sticky sessions enabled and if our pointer is not nil.
- If those are true we’ll convert our index from string to int, and then look it up in our list of servers.
- Before fetching our server from its index we make sure that we successfully converted an integer, and that it’s within bounds for the server array.
- We may not end up with a server after all that checking, so check if our current server is the same as an empty server, and call
NextServermethod if so. - We see what server we’re going to, and make a cookie to set on the response so the next request goes to the same server.
- That cookie is attached with the
SetCookiefunction from the standardhttplibrary… - … and we’re ready to proxy our request like we did before.
The final touches are adding our sticky sessions flag and including that value when we create our flag in our load balancer.
var (
	s1             = flag.String("s1", "http://localhost:8080/", "first server")
	s2             = flag.String("s2", "http://localhost:8081/", "second server")
	ratio          = flag.Uint("ratio", 5, "How many requests out of 10 should go to server 1, default 5")
	stickySessions = flag.Bool("sticky", false, "Enable sticky sessions")
)

// Later
loadBalancer := LoadBalancer{
	servers:        []Server{server1, server2},
	rng:            rand.New(rand.NewSource(time.Now().UnixNano())),
	ratio:          int(*ratio),
	stickySessions: *stickySessions,
}
Great! Now our load balancer supports sticky sessions.
Testing sticky sessions#
We should run our load balancer test go run test/run_lb.go again to make sure things are working, and while we’re at it, let’s update it so we can test sticky sessions. This will involve a few additions to our runner:
- accepting flags to determine what we’d like to test
- passing the proper arguments to our load balancer
- making sure our requests receive and return cookies when necessary
Let’s start with the flags. We can have one flag for the load balancer ratio and one for whether or not to use sticky sessions, and put them at the top of the main func.
var (
	ratio  = flag.Uint("ratio", 5, "How many requests out of 10 should go to server 1, default 5")
	sticky = flag.Bool("sticky", false, "enable sticky sessions")
)
flag.Parse()
Now that we have option flags, we need to pass those options to our load balancer. However, we won’t necessarily always include every option, so we don’t know how many extra arguments we need to pass to our load balancer. But we can create a slice of the options will always include and append any additional options we’ve selected to add on to that.
The ratio will always be passed, even if it’s using the default of 5, but we might not send sticky sessions every time. We can use the variadic argument operator ... to add our slice of arguments to the load balancer command.
extraArgs := []string{"-ratio", fmt.Sprintf("%d", *ratio)}
if *sticky {
	extraArgs = append(extraArgs, "-sticky")
}

ctx, cancel := context.WithTimeout(context.Background(), 4*time.Second)
lbCmd := exec.CommandContext(ctx, "./load_balancer", extraArgs...)
err := lbCmd.Start()
Since we can now optionally change our load balancer to include sticky sessions, we need to adjust our requests to accept and send cookies. We can’t simply use http.Get anymore - we need to do an httpNewRequest so we can add a cookie to it if we’ve received one. Then we use the http.DefaultClient to execute our request with the potentially-attached cookie. After sending the request, we check to see if we received a cookie, and make it available for our subsequent requests.
var serverCookie *http.Cookie
for i := 0; i < 10; i++ {
	req, _ := http.NewRequest("GET", "http://localhost:8888", nil)
	if serverCookie != nil {
		req.AddCookie(serverCookie)
	}

	resp, err := http.DefaultClient.Do(req)
	if err != nil {
		fmt.Println(err)
		continue
	}

	cookies := resp.Cookies()
	if len(cookies) == 1 {
		serverCookie = cookies[0]
	}

	body, err := io.ReadAll(resp.Body)
	if err != nil {
		fmt.Println(err)
	} else {
		fmt.Print(string(body))
	}
	resp.Body.Close()
}
We can run our tester with go run test/run_lb.go -sticky , and see that all requests go to the same server every time, regardless of the ratio we set. If we include the ratio flag -ratio NUM but not -sticky , we should see the ratio having an effect.
With that, we can move on. We’re going to add a new type of load balancing to our canary deployment server.
Round robin load balancer#
Round robin is a style of load balancing where instead of a server being chosen randomly, the load balancer iterates through the servers based on a predetermined order. In weighted round robin load balancing, the number of consecutive uses of the same server will be based on the weight each server has. In this case, weight is a number you choose that increases the percentage of requests that will go to an indivudal server. Servers with higher weights tend to be more powerful servers with higher CPU counts and RAM capacity.
You can think of weight like a counter. As we receive requests, we send them to one server while keeping count. Once the count is greater than the weight set for that server, we switch to the other one, and restart our count. Again once we have counted more than the number assigned to the second server, we will switch to another (or in our case back to our original server), and begin counting again.
In this section, we’re going to be implementing a relatively simple weighted round robin. But first, why would we want round robin, and in particular why a weighted round robin?
If our two servers were to be relatively similar to each other, it shouldn’t matter which one a request is sent to, so round robin would be a “fair” load balancer, evenly distributing load to each server. The addition of weighting could help us in cases where our servers aren’t well-matched, sending an appropriate ratio of requests to each server.
Regardless, it is a relatively common load balancing strategy, so we’re going to add it as an option for our canary deployment server.
Because we now have two methods of load balancing, let’s first create a type for our load balancing style, as well as constants for those two possibilities. In the load_balancer file:
// LBStyle is an enum for what type of LB we have. type LBStyle int const ( // RandomPerRequest sends you to a random backend every time. RandomPerRequest LBStyle = iota // RoundRobin sends you to the next server in the list. RoundRobin )
Here we’ve set up our two types of LBStyle , using Go’s iota keyword to give our two types values. Iota works by starting with the value 0 and increasing by 1 for every new line that isn’t a comment or all empty space. It combines well with const s implicit repitition, where any line without the = expression will repeat the most recent line that included it. So here our RandomPerRequest is set to 0 , and RoundRobin is implicitly set to 1 . Both of them have also have the LBStyle type, instead of directly being an int .
Now that we have this type we need to add it to our LoadBalancer definition, along with a counter which will let us properly determine where in the round robin count we are, and a sync.Mutex lock, which will let us update the round robin counter in a threadsafe manner.
// LoadBalancer is a collection of Servers.
type LoadBalancer struct {
	servers        []Server
	rng            *rand.Rand
	ratio          int
	stickySessions bool
	style          LBStyle
	counter        int
	lock           sync.Mutex
}
And now, the fun part.
Depending on what style of load balancing we are doing, we will need to change what our NextServer does. If LBStyle is RandomPerRequest, we’ll just do the same as before. But if it’s RoundRobin, we have to use the counter to determine where to go. In both cases we will get a comparator number which will be used as an index to select a server.
// NextServer generates a random integer to determine if the 1st or 2nd Server should be proxied to.
// When the random integer is greater or equal to the ratio, proxy the request to the 2nd Server.
//
// We always assume there are two Servers.
func (lb *LoadBalancer) NextServer() Server {
index, comparator := 0, 0
if lb.style == RandomPerRequest {
comparator = lb.rng.Intn(10)
} else if lb.style == RoundRobin {
lb.lock.Lock()
defer lb.lock.Unlock()
comparator = lb.counter
lb.counter = (lb.counter + 1) % 10
}
if comparator >= lb.ratio {
	index = 1
}

return lb.servers[index]
}
Finally we can set up a roundRobin flag to choose between the two load balancing methods, and then add it to the load balancer in our main func.
We can also update our tester fairly simply with another flag and an optional extra arg, like so:
var (
	s1             = flag.String("s1", "http://localhost:8080/", "first server")
	s2             = flag.String("s2", "http://localhost:8081/", "second server")
	ratio          = flag.Uint("ratio", 5, "How many requests out of 10 should go to server 1, default 5")
	stickySessions = flag.Bool("sticky", false, "Enable sticky sessions")
	roundRobin     = flag.Bool("round", false, "Use Round Robin load balancing style (default is random per request)")
)
flag.Parse()

style := RandomPerRequest
if *roundRobin {
	style = RoundRobin
}

// Later
loadBalancer := LoadBalancer{
	servers:        []Server{server1, server2},
	rng:            rand.New(rand.NewSource(time.Now().UnixNano())),
	ratio:          int(*ratio),
	stickySessions: *stickySessions,
	style:          style,
	lock:           sync.Mutex{},
}
Configuration server#
We currently have one fairly large issue with our canary deployment server. Whenever we want to modify its configuration, we need to restart it, so there will always be some downtime when we adjust our load balancing style, balance ratio, etc. As we’re building this to allow for the seamless deploy of new versions, that is a pretty big issue - but one that we can definitely fix!
To do that, we’re going to allow our server to read and write configuration from another server, and to update itself on the fly. Normally one might use something like etcd or consul to store our configuration. But - good news - we’ve already written a key-value server! So we will use that.
But first, let’s talk tradeoffs - our system is about to get a lot more complex. Not only do we need to have an entire other system running, but we need to determine how we set that system up, and how it is able to adjust our canary deployment server.
This is, however, necessary complexity. As it stands, our canary deployment server can’t really do what it’s intended to do. So let’s get to it!
Configuration change method#
We can start by deciding how we want to have our configuration updated. We need a server that will store our configuration and allow it to be updated, with an update rate to allow us to get updates regularly. Since our total amount of configuration is relatively small (we only care about the load balancing method, ratio, sticky sessions, config server and rate) we can simply make that into a serializable struct, and allow it to be read and written on our configuration server.
JSON is a nice simple encoding with great standard library support in the encoding/json package, and we can attach it directly to the struct used for configuration. To support that, we need to do a quick refactor. In the load_balancer file, we can pull our load balancer config into its own struct, give it the proper tags and attach it to the load balancer, adding our config server and update rate at the same time.
// LoadBalancerConfig holds our load balancer’s configuration. type LoadBalancerConfig struct { Ratio int json:"ratio" StickySessions bool json:"sticky_sessions" Style LBStyle json:"lb_style" Server string json:"server" UpdateRate time.Duration json:"update_rate" } // LoadBalancer is a collection of Servers. type LoadBalancer struct { servers []Server rng *rand.Rand counter int lock sync.Mutex Config *LoadBalancerConfig }
Quick note, because we have pulled a number of fields that used to be in LoadBalancer into LoadBalancerConfig , our (lb *LoadBalancer) NextServer and (lb *LoadBalancer) ProxyRequest functions need to be updated to call into the new Config struct. Specifically in NextServer , lb.style will become lb.Config.Style and lb.ratio will become lb.Config.Ratio . For ProxyRequest , lb.stickySessions will become lb.Config.StickySessions .
Now that we have the configuration, we need to write the update methods.
Updating configuration#
To finalize our configuration setup, we need four main pieces:
- writing configuration
- reading configuration
- updating configuration while running
- setting our update rate to regularly do the above
Writing configuration
We could technically skip this, but then setting up our config server might fall to some strange bash script. We already know what configuration we care about, so we can easily use our server to set up its own config. Given a fully setup LoadBalancerConfig , we can marshal it and send a Post request to our key-value server, doing some simple error checking along the way.
// SetupServer sets up our configuration on our configuration server. func (lbc *LoadBalancerConfig) SetupServer() error { config, err := json.Marshal(*lbc) if err != nil { return err } body := bytes.NewBuffer(config) resp, err := http.Post(lbc.Server, “application/json”, body) if err != nil { return err } resp.Body.Close() if resp.StatusCode >= 400 { return fmt.Errorf(“Received bad response code during server setup: %d”, resp.StatusCode) } return nil }
Reading configuration
With that in place, we can also make a method to read from our server - essentially the reverse. We read from our key-value server and unmarshal the resulting response body.
// ReadServer gets our configuration from our configuration server. func (lbc *LoadBalancerConfig) ReadServer() (*LoadBalancerConfig, error) { if lbc.Server == “” { return nil, fmt.Errorf(“Config server required but server was empty”) } resp, err := http.Get(lbc.Server) if err != nil { return nil, err } defer resp.Body.Close() var newConfig *LoadBalancerConfig err = json.NewDecoder(resp.Body).Decode(&newConfig) return newConfig, err }
Updating configuration
With reading and writing complete, we can now update our config. Instead of attaching the update method to the LoadBalancerConfig , we will attach this one to the LoadBalancer itself. That way Update can simply be called on the LoadBalancer and will handle updating itself in a safe manner. Already having our ReadServer method makes this a rather simple method. Call that, and update the config using our load balancer’s lock to ensure safety.
// Update updates the LB config. func (lb *LoadBalancer) Update() error { config, err := lb.Config.ReadServer() if err != nil { return err } lb.lock.Lock() defer lb.lock.Unlock() lb.Config = config return nil }
Setting regular updates
Finally we can use these methods to allow our server to regularly update. The main piece here is a time.Ticker . It will write to a channel spaced by the duration we give it. Using this and Go’s select statement, we can create an infinite loop that will regularly update our config forever, or until we intentionally stop it.
Our stop method will be a Go function that writes to a separate stop channel in our select statement.
The only other special case is when we get an UpdateRate config change. When this happens, we can change the ticker in place.
Otherwise, we don’t have any other major concerns. Things will look like this:
// SetUpdateRate defines how often we should update the server config. func (lb *LoadBalancer) SetUpdateRate(rate time.Duration) func() { // A rate should never be zero or less, default to 10 seconds if rate <= 0 { rate = 10 * time.Second } t := time.NewTicker(rate) stop := make(chan bool) go func() { for { select { case <-t.C: err := lb.Update() if err != nil { // Don’t fatal on errors, as they may be transient log.Println(err) } else if lb.Config.UpdateRate != rate && lb.Config.UpdateRate != 0 { t.Reset(lb.Config.UpdateRate) rate = lb.Config.UpdateRate } else if lb.Config.UpdateRate == 0 { return } case <-stop: return } } }() return func() { stop <- true } }
Gluing it together#
We have all the necessary methods in place, so now we need to update the main function of load_balancer to match. We need flags for whether we are setting up rather than running, and if we have an update rate.
configURL   = flag.String("config", "", "Optional config server url")
updateRate  = flag.Duration("update", 1*time.Second, "How many seconds between configuration refreshes (requires trailing s for seconds)")
setupConfig = flag.Bool("setup", false, "If enabled, sets up the config server and then exits")
We also need to update our general LoadBalancer setup with our config struct:
loadBalancer := LoadBalancer{
	servers: []Server{server1, server2},
	rng:     rand.New(rand.NewSource(time.Now().UnixNano())),
	lock:    sync.Mutex{},
	Config: &LoadBalancerConfig{
		Ratio:          int(*ratio),
		StickySessions: *stickySessions,
		Style:          style,
		Server:         *configURL,
		UpdateRate:     *updateRate,
	},
}
When we have the setupConfig flag set, we can do config server setup and then stop before starting up the load balancer.
if *setupConfig && loadBalancer.Config.Server != "" {
	err := loadBalancer.Config.SetupServer()
	if err != nil {
		log.Fatalf("Problem setting up config server: %s\n", err)
	}
	log.Println("Config server successfully setup")
	return
}
Otherwise, we can simply update our config from our config server if we have one, and set up our rate before starting our load balancer as normal.
if loadBalancer.Config.Server != "" {
	err := loadBalancer.Update()
	if err != nil {
		log.Fatalf("Issue updating from config server: %s\n", err)
	}

	loadBalancer.SetUpdateRate(loadBalancer.Config.UpdateRate)
}

// Start the servers
And we’re done! We now have a canary deployment server that will balance load across two servers at a ratio of our choosing, with either random per request or round robin style load balancing.
Sticky sessions can be enabled if we need users to only ever go to one server or the other, and the server can both set up and use a configuration server to regularly update itself as deployments happen.
Other considerations#
There are a lot of considerations that our canary deployment server doesn’t cover. We went over a number in the What aren’t we doing? section earlier - things like more than two servers for the backend, and health checks.
Most of the concepts we glossed over are related to the load balancing aspect of this system. Ours is not designed to be an incredibly scalable or feature-full load balancer. That aspect could certainly be improved.
For example, if one needed this load balancer to have some aspect of reproducibility for requests, a new load balancing method would be necessary. It could potentially hash information about the request, like the IP or a combination of headers. This would allow it to remain fast, but also allow someone looking at the system to understand where a request would have been routed. That’s something that can’t be done with random per request, due to its randomness, or round robin, due to its statefulness.
Other important considerations that could lead to improvements are around the deployment aspect of this server. Right now, deployments would be entirely manual. A new version of the service would be set up, and the configuration server would be updated to allow some amount of traffic to go to the new service. But continuing after that, or rolling back, are the same kind of action - manually updating the configuration server. Automating some aspect of that, for continually-staged rollouts or rollbacks would be a great improvement to the user-friendliness of this system.
Open source load balancers#
There are a lot of good load balancers written in Go which could give more inspiration for improvements to this system.
Chat server#
In previous chapters, we have discussed a number of applications with various storage needs. One of those, the distributed key-value server, was fairly complex. It required the use of the Raft algorithm to ensure consensus. But the data model has so far remained simple - just keys and values.
Now we’re going to look at an application where the data model is more complicated - we’re going to build a chat server.
Chatting about chat servers#
Chat servers have many powerful and scalable protocols around which they can be designed, like XMPP or IRC. These are battle-tested concepts which have enabled the creation of a lot of excellent systems. But these protocols are not trivial to implement yourself, and at the end of the day, chat server functionality can simply take text from a message one person creates and send it to many other people.
So, instead of using these protocols (which is otherwise a great idea with a long track record of success) we are going to write something a lot simpler. It won’t be anywhere near as proven, but it will allow us to show a number of important concepts without getting into the weeds of protocol implementation.
That being said, we do recommend taking a look at these protocols, as getting a better understanding of them would be an excellent learning experience.
Why are we making a chat server?#
You may be wondering why we have chosen to create a chat server. It doesn’t entirely fit into the theme of the other applications we have built in this book. Our key value server and canary deployment server are more of building blocks for web applications, while the chat server is more of an application itself. Well, the chat server will allow us to talk about a number of important concepts in this chapter. The first is relational data and SQL . Relational data is incredibly common in web development, as websites and applications tend to involve concepts that have relationships. For example, messages are sent by users, and users send messages. That’s a relation, and being able to properly store and retrieve it is important.
This is where SQL comes in! SQL is not the only way to retrieve relational data, but much like the tried and true chat server protocols above, SQL has been around for a while and continues to be around because it works. Many incredibly performant and scalable databases use SQL as the way that they read and write data, like PostgreSQL, MySQL and SQLite, so it’s important to understand how to interact with a SQL database using Go.
Another important concept is authentication. Any website that has the concept of a user also has the concept of authentication . If you want to enable users to take actions, you need to be able to ensure you know who a user is. So, we will also be discussing a common web standard method for user authentication, signed cookies .
Now that we know what concepts the chat server will let us cover, we can move on to the list of features we will not be implementing at this time.