INTRODUCTION TO THE PROJECT
The goal of this project is to create a simple Google Analytics Dashboard.
The Google Analytics interface provides lots of information and can satisfy all your needs. However, having a quick glance at all your sites is hard as you need to go through each one of them separately. This is why we’ll build our own little app, that you can run and have a quick look at how things are going in terms of traffic.
This app shows stats from all the sites you have access to on Google Analytics.
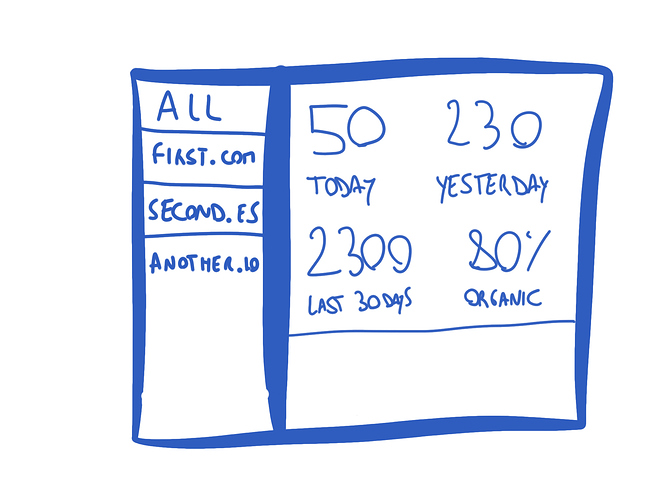
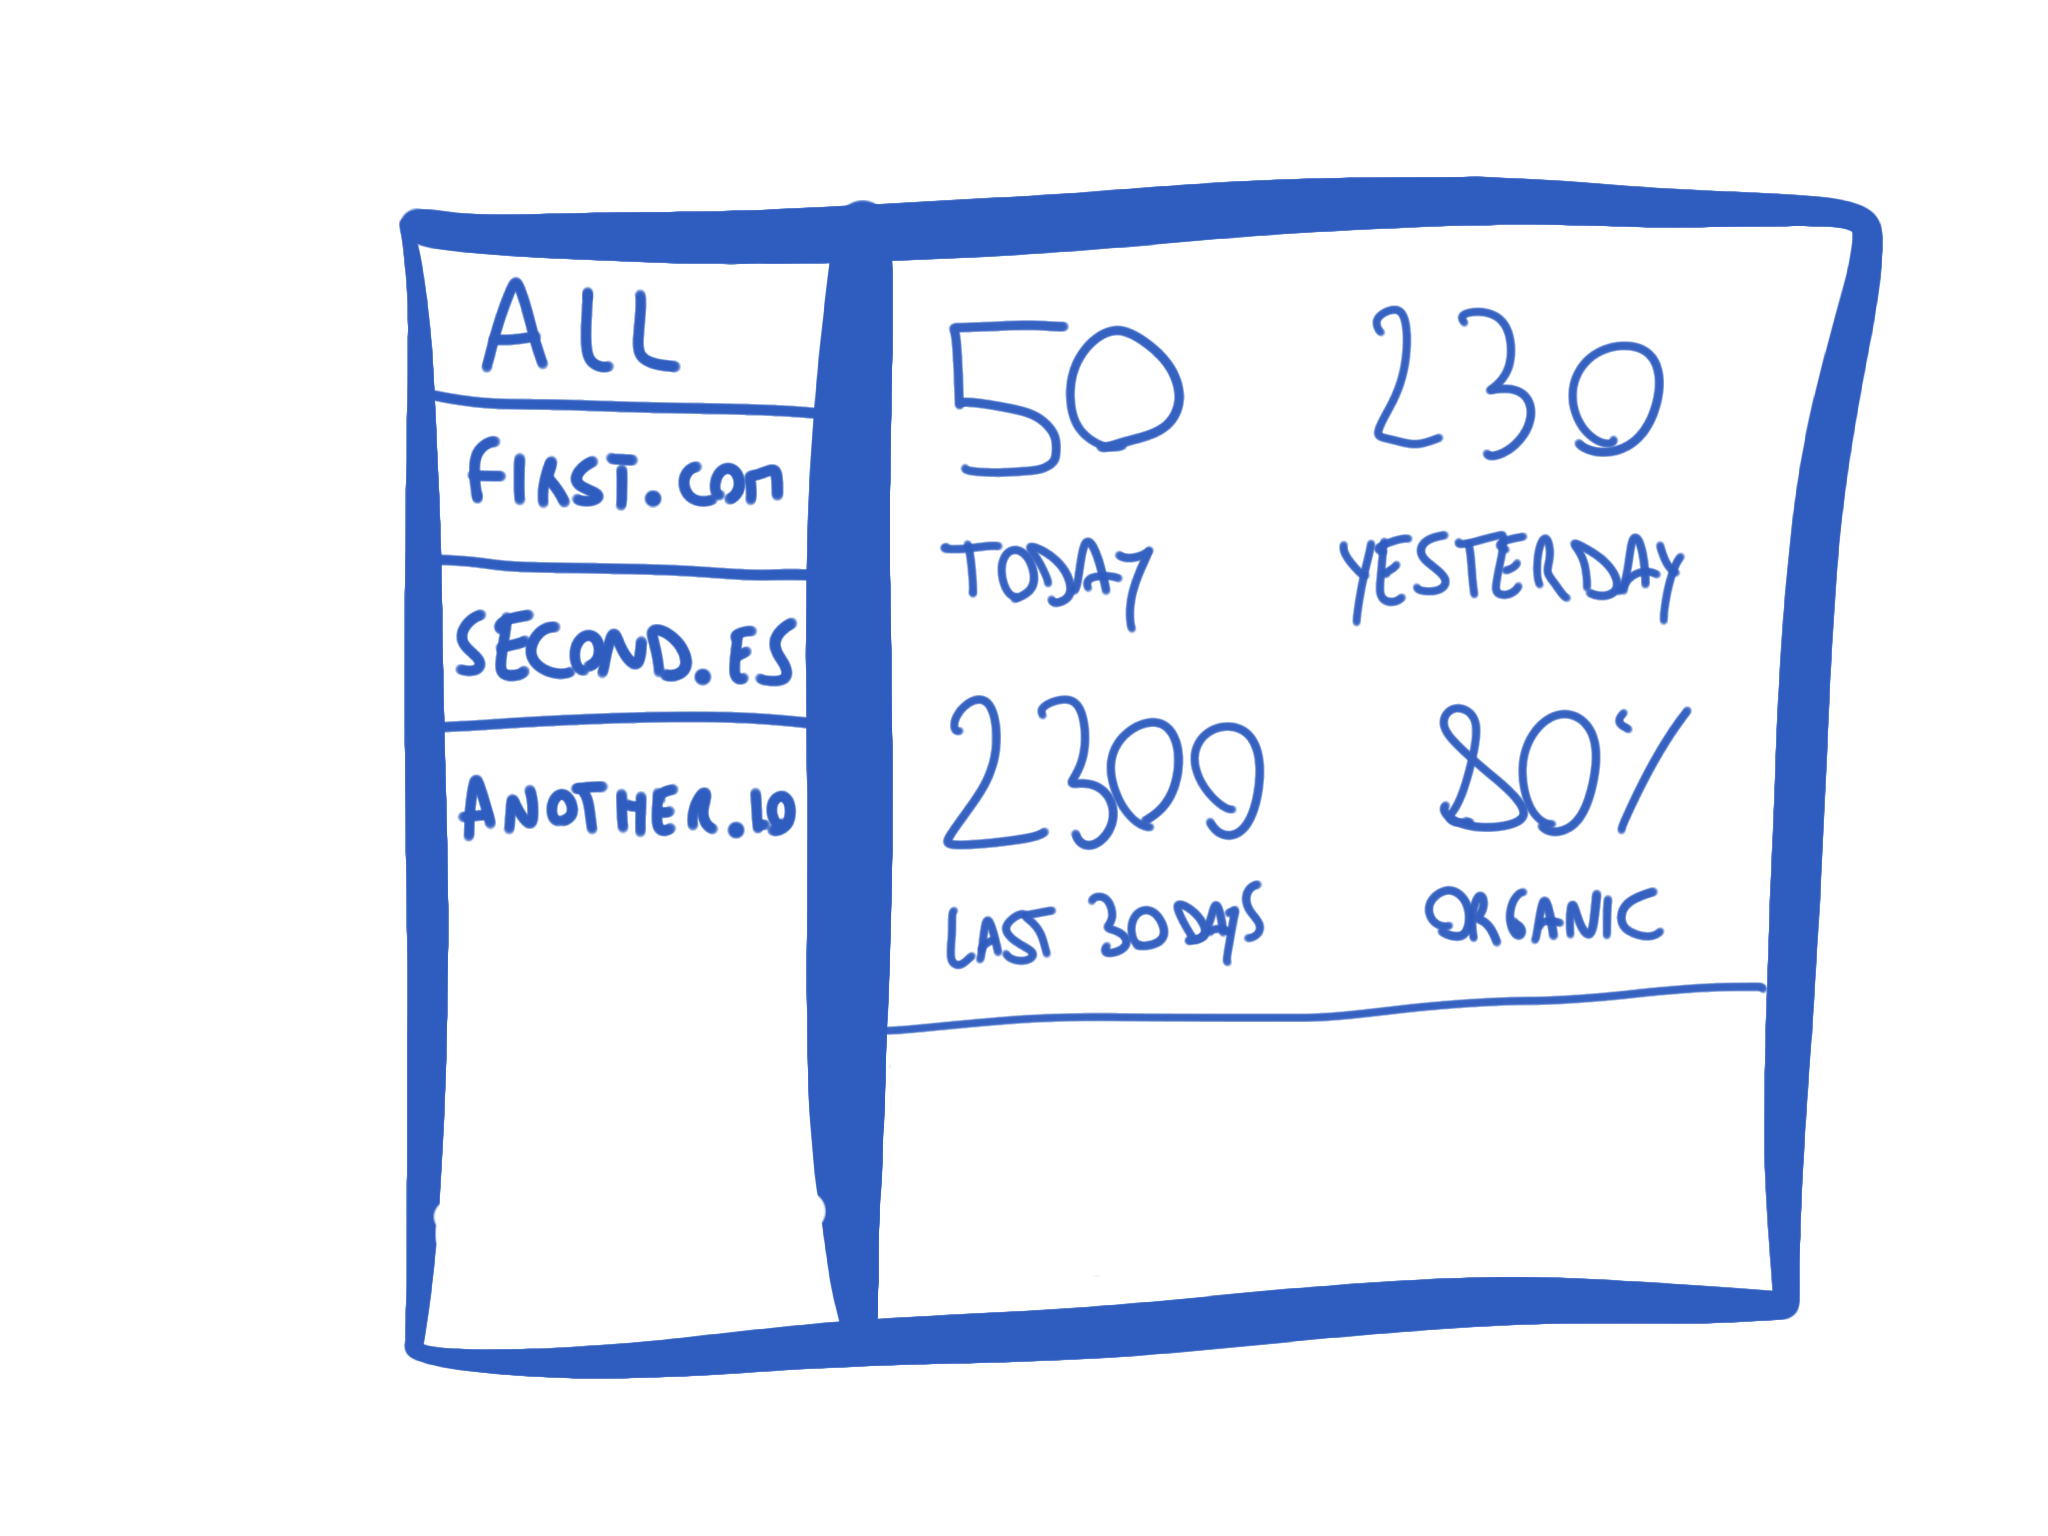
This is the general idea:
There is a sidebar, which lists your sites.
You can click each one of the sites in the sidebar, and the app will only show the data for that site, otherwise it shows an aggregate of all your online properties.
We’ll use this project to learn about several things related to Node.js development:
- perform requests to an API server
- handle authentication with a 3rd party service, in this case Google Analytics
- create an Express web server
- how to perform server-side rendering of web pages
and more!
FIRST STEPS, SET UP GOOGLE ANALYTICS
Let’s start from creating the procedure to authenticate with Google Analytics .
CREATE A NEW GOOGLE API PROJECT
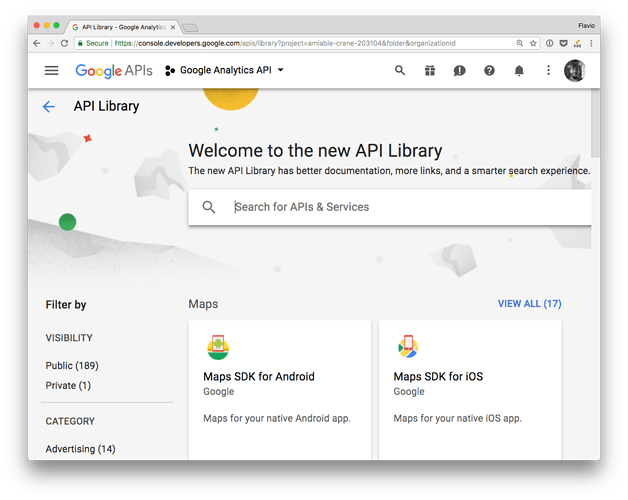
The first thing we need to do is to create a new project on the Google API console.
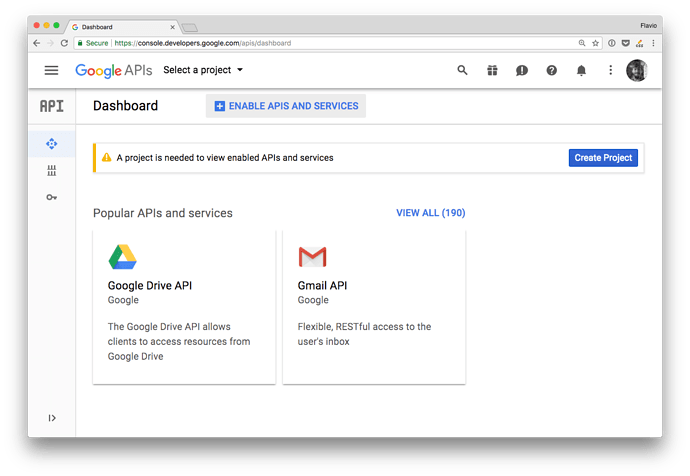
From the dashboard click Create a new project .
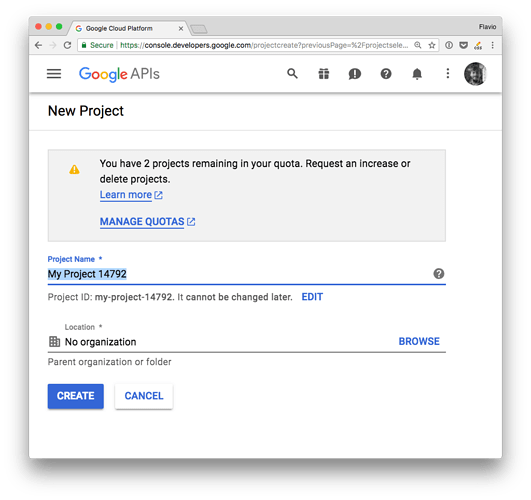
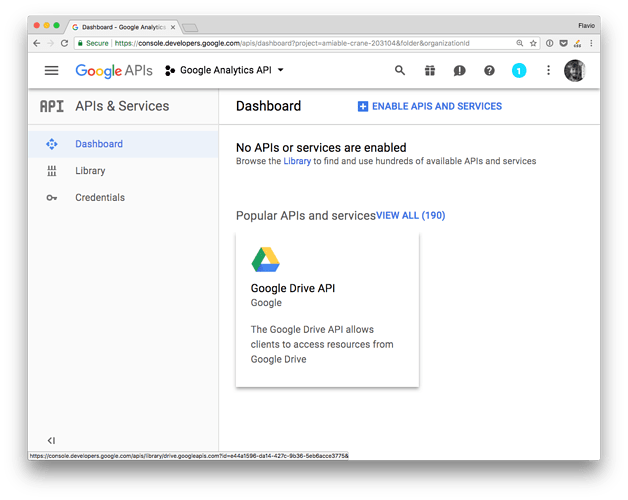
Give it a name, and you’ll be redirected to the project dashboard:
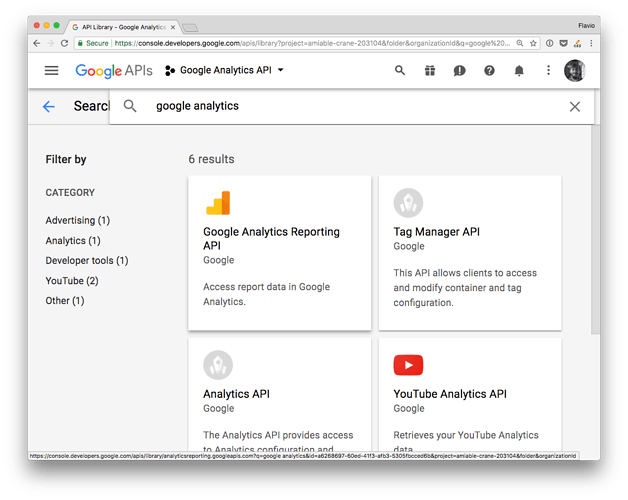
Add an API by clicking Enable APIs and services .
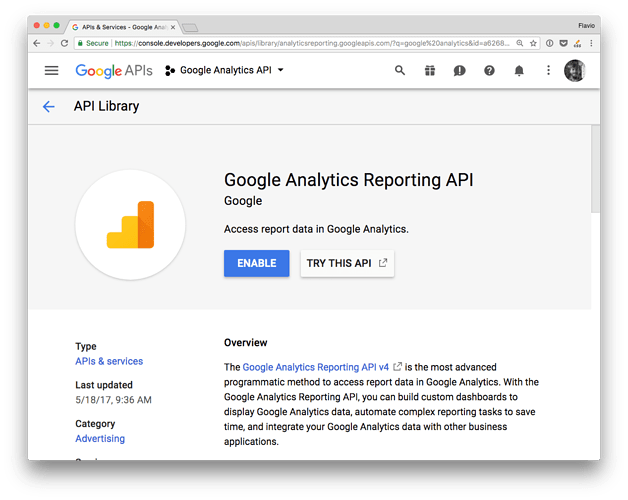
From the list, search the Google Analytics API:
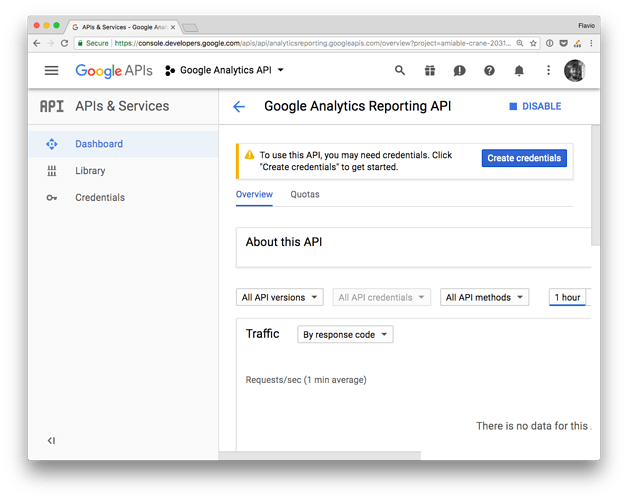
and enable it
That’s it!
The project is now ready, we can go on to create the authentication credentials.
CREATE THE AUTHENTICATION CREDENTIALS
There are 3 ways to authenticate with the Google APIs:
- OAuth 2
- Service to Service
- API key
API key is less secure and restricted in scope and usage by Google.
OAuth 2 is meant to let your app make requests on behalf of a user, and as such the process is more complicated than needed, and requires exposing URLs to handle callbacks. Way too complex for simple uses.
In a Service to Service authentication model, the application directly talks to the Google API, using a service account, by using a JSON Web Token .
This is the simplest method, especially if you’re building a prototype or an application that talks from your server (like a Node.js app) to the Google APIs. This is the one method I’ll talk about for the test of the article.
SERVICE TO SERVICE API
To use this method you need to first generate a JSON Key File through the Google Developers Console.
There is another option which involves downloading a
.p12file and then converting it to apemfile using theopensslcommand. It’s no longer recommended by Google, just use JSON .
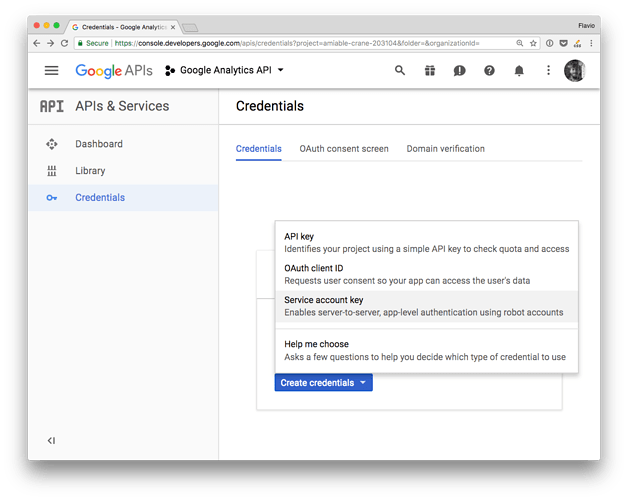
From a project dashboard, click Create credentials , and choose Service Account Key :
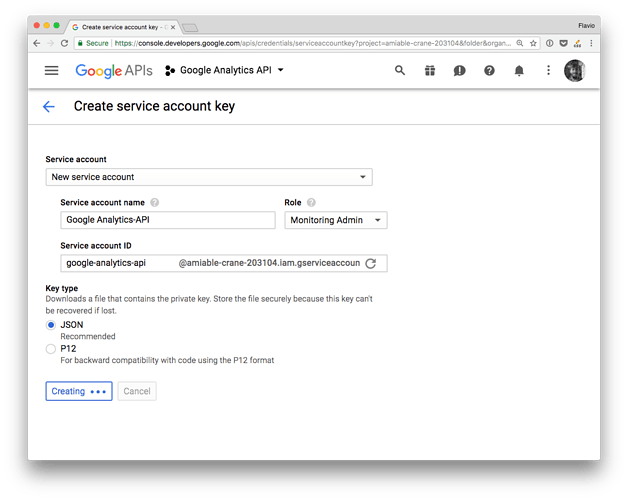
Fill the form and choose a “JSON” key type:
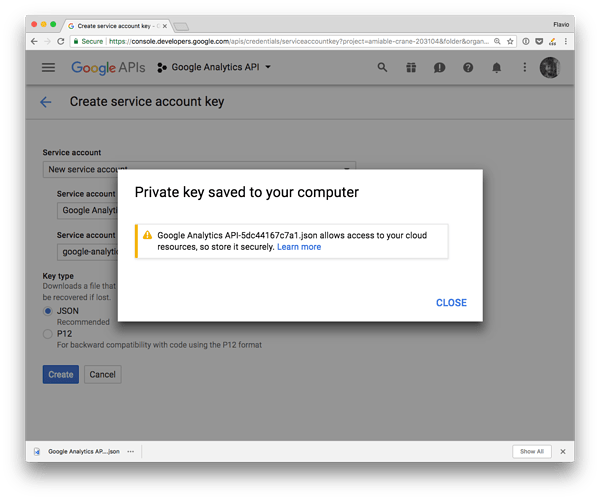
That’s it! Google sent you a JSON file:
This is the content of this JSON file, called JSON Key File :
{
  "type": "service_account",
  "project_id": "...",
  "private_key_id": "...",
  "private_key": "...",
  "client_email": "...",
  "client_id": "...",
  "auth_uri": "https://accounts.google.com/o/oauth2/auth",
  "token_uri": "https://accounts.google.com/o/oauth2/token",
  "auth_provider_x509_cert_url": "https://www.googleapis.com/oauth2/v1/certs",
  "client_x509_cert_url": "..."
}
We’ll use some of these values in our program, by adding them as environment variables.
ADD THE USER TO GOOGLE ANALYTICS
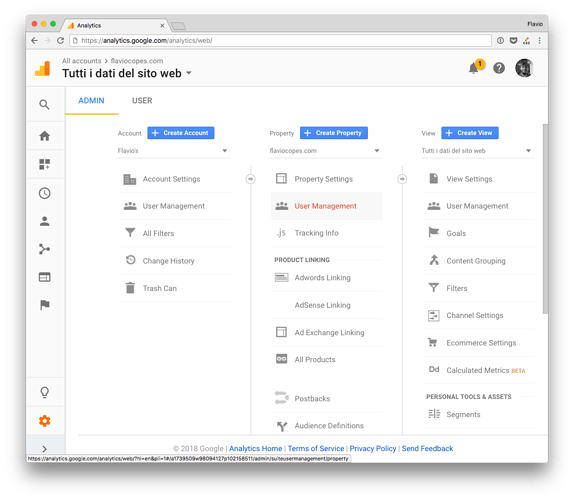
Since we’re using the Service to Service API, you need to add the client_email value we just got in the JSON file to your Google Analytics profile. Go to the Admin panel and click User Management , either on an account or a property. If you do it on a property, you’ll only have access to the single property (you can add more than one later).
Do it on an account to have access to all your properties at the same time.
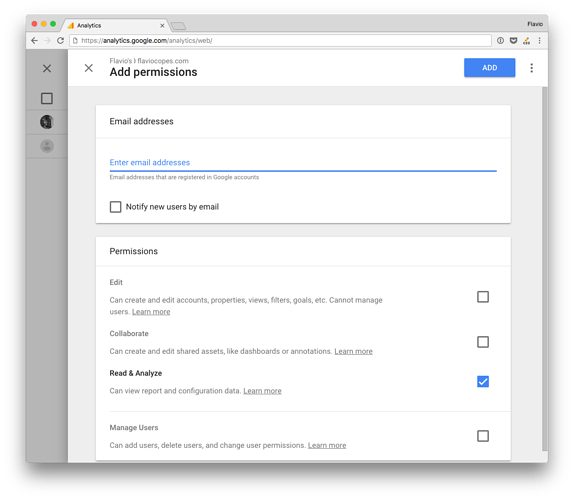
And add the email you found in the client_email key in the JSON file, and make sure you click the “Read and Analyze” permission:
LET’S START TO CODE, GET THE PROPERTIES LIST
Enough with the Google Analytics configuration! We can start coding now.
In this lesson we’ll get the list of sites you have access to .
You can build this project using Glitch. Glitch is a great platform to experiment and build sample apps. See my Glitch overview post to know more about it.
We start from a blank canvas by clicking “New Project” and selecting hello-express .
There is some boilerplate code we’ll use later. Now open server.js and let’s focus on the Google Analytics authentication.
ADD THE ENVIRONMENT VARIABLES
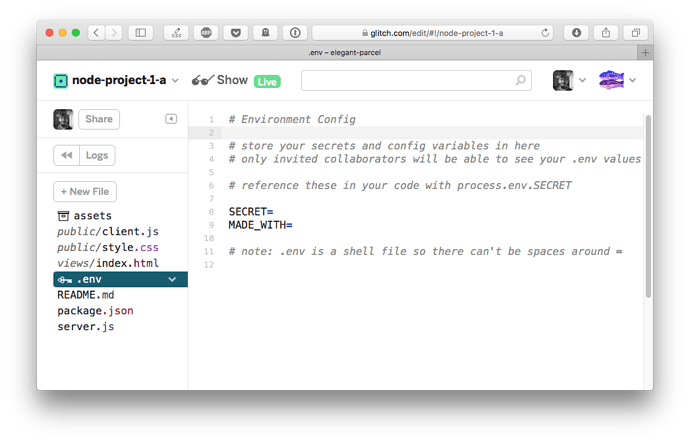
Add the client_email and private_key values you got in the JSON file to the Glitch .env file.
This is what it currently contains:
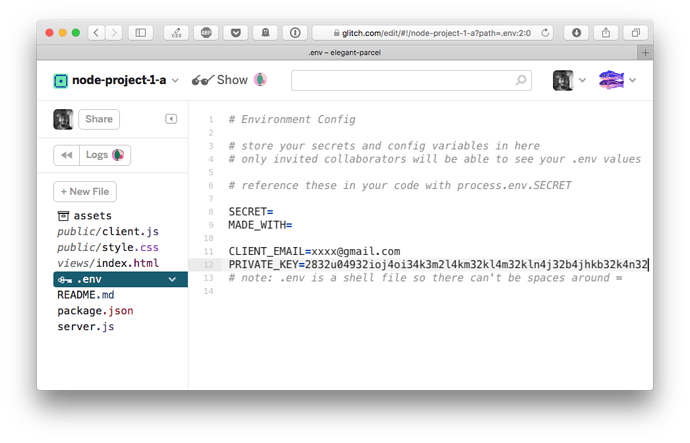
Create a CLIENT_EMAIL= entry, and a PRIVATE_KEY= entry, and add the corresponding value.
Example:
The PRIVATE_KEY value will be something very long. I found that to make it work on Glitch, you need to add a $ symbol and wrap it in quotes ( ' ), like this:
PRIVATE_KEY=$'-----BEGIN PRIVATE KEY-----\nFRBvgIBISK..... VERY_LONG_THING.... .OapM8nr35NXjrDqF32joi4j32o4m32km4kl3m\n-----END PRIVATE KEY-----\n'
We also need one last environment variable: ACCOUNT_ID: your Google Analytics account ID.
MPORT THE GOOGLE LIBRARY
Google offers a great library to work with their API, conveniently called googleapis . We’ll use that.
First, add it to Glitch by opening the package.json file, and click the “Add package” button. You search for googleapis , click the package and it’s added to the project dependencies.
You can now require it in the server.js file. Freely remove all the other code that’s already present in that file.
const { google } = require('googleapis')
Remember the {} around the google object, as we need to destructure it from the googleapis library (otherwise we’d need to call google.google and it’s ugly)
DEFINE THE SCOPE
We need to tell Google the scope of our usage. We only want to access the API in read mode, so we’ll use the analytics.readonly scope.
This line sets the scope:
const scopes = 'https://www.googleapis.com/auth/analytics.readonly'
Google Analytics API defines several scopes:
-
https://www.googleapis.com/auth/analytics.readonlyto view the data -
https://www.googleapis.com/auth/analyticsto view and manage the data -
https://www.googleapis.com/auth/analytics.editto edit the management entities -
https://www.googleapis.com/auth/analytics.manage.usersto manage the account users and permissions -
https://www.googleapis.com/auth/analytics.manage.users.readonlyto view the users and their permissions -
https://www.googleapis.com/auth/analytics.provisionto create new Google Analytics accounts
You should always pick the scope that grants the least amount of power.
For example, we could use https://www.googleapis.com/auth/analytics but since we want to only view the reports now, we pick https://www.googleapis.com/auth/analytics.readonly instead of https://www.googleapis.com/auth/analytics .
CREATE THE JWT
This code creates the JWT token.
const jwt = new google.auth.JWT(process.env.CLIENT_EMAIL, null, process.env.PRIVATE_KEY, scopes)
Notice how we can access the variables stored in the .env file by using process.env.
JWT stands for JSON Web Token, and it’s an open standard to create secure access tokens.
Once we got the token, we can pass it as part of a request, and we are able to confirm our identity to the server.
THE CODE UP TO NOW
This is what we have:
const { google } = require('googleapis')
const scopes = 'https://www.googleapis.com/auth/analytics.readonly'
const jwt = new google.auth.JWT(process.env.CLIENT_EMAIL, null, process.env.PRIVATE_KEY, scopes)
The code is already running because Glitch restarts the application every time a change is detected.
Open the logs by clicking the “Logs” button to find out what is happening:
LET’S PERFORM THE FIRST REQUEST: GET THE NAMES OF ALL THE PROPERTIES YOU HAVE ACCESS TO
To do so, we create a function called getData() .
We first call jwt.authorize() , and then we call the Google Analytics API, passing the jwt object, and our account id:
function getData() {
  jwt.authorize()
  google.analytics('v3').management.webproperties.list({
    'auth': jwt,
    'accountId': process.env.ACCOUNT_ID
  }).then(result => {
    console.log(result.data.totalResults)
  })
}
As you can see we call google.analytics('v3').management.webproperties.list() . How do I know that this specific method was the one to call? From the Google API documentation. This page https://developers.google.com/analytics/devguides/config/mgmt/v3/quickstart/web-js lists a few examples, including the one I used here.
We can transform the above code to use async/await. If you are not familiar with this syntax, read modern Asynchronous JavaScript with Async and Await.
Instead of appending a .then() method that is called when the promise is resolved, we use:
const result = await google.analytics('v3').management.webproperties.list({
  'auth': jwt,
  'accountId': process.env.ACCOUNT_ID
})

console.log(result.data.totalResults)
This syntax is handy because we use less functions and the flow of the program is always on the top level.
To be able to use it, we must also add the async keyword to the getData() function declaration:
async function getData() {
  const response = await jwt.authorize()
  const result = await google.analytics('v3').management.webproperties.list({
    'auth': jwt,
    'accountId': process.env.ACCOUNT_ID
  })

  console.log(result.data.totalResults)
}

getData()
Now, let’s get the names of the properties we can access. We now log the number of properties, accessible through result.data.totalResults .
result.data.items gets us the details of each property, as an array. We can use the map() array method to get the property names and IDs:
return result.data.items.map(item => { return { name: item.name, id: item.defaultProfileId }})
Check the project console for the list. This list will be the base of the sidebar list of properties.
WARNING: There is one problem I noticed when I tested this. Maybe the profile I was using was too old (it was my first site I added to GA), but the id property was undefined . We’ll filter out sites that have this issue, but definitely check if you have such a problem too, to avoid being tricked into having less visits than you think.
How can we do this?
return result.data.items.map(item => { return item.defaultProfileId ? { name: item.name, id: item.defaultProfileId } : false })
This means “create a new array, and include one entry only if item.defaultProfileId is not null or undefined . Each entry contains a name and id property”.
Here’s the full code at this point:
const { google } = require('googleapis')
const scopes = ['https://www.googleapis.com/auth/analytics', 'https://www.googleapis.com/auth/analytics.edit']
const jwt = new google.auth.JWT(process.env.CLIENT_EMAIL, null, process.env.PRIVATE_KEY, scopes)

async function getPropertiesList() {
  const response = await jwt.authorize()
  const result = await google.analytics('v3').management.webproperties.list({
    'auth': jwt,
    'accountId': process.env.ACCOUNT_ID
  })

  return result.data.items.map(item => { return item.defaultProfileId ? { name: item.name, id: item.defaultProfileId } : false })
}

async function getData() {
  console.log(await getPropertiesList())
}

getData()
The code for this project is available on https://glitch.com/edit/#!/node-course-project-analytics-dashboard-a?path=server.js:20:0
GET THE COUNT OF VISITS IN A DAY
Now we are able to interact with the Google Analytics API.
We’ll generate the stats we’ll later use to create the User Interface.
To start with, we are interested in the following data:
- Get today’s visits. Organic / total
- Get yesterday’s visits. Organic / total
- Get last 30 days visits. Organic / total
GET DAILY VISITS
To get data from the Google API, we use the Google Analytics Reporting API v4, offered by the googleapis library via the analyticsreporting object.
We initialize it using
const analyticsreporting = google.analyticsreporting({
	version: 'v4',
	auth: jwt
})
where jwt is the JSON Web Token we defined previously.
Then we call it, using
const res = await analyticsreporting.reports.batchGet({
  requestBody: {
    reportRequests: [{
      viewId: VIEW_ID_HERE,
      dateRanges: [{
        startDate: START_DATE_HERE,
        endDate: END_DATE_HERE
      }],
      metrics: [{
        expression: 'ga:sessions'
      }]
    }]
  }
})
This syntax is specific to the Google API, and I got it from the examples provided in its documentation.
VIEW_ID_HERE is a placeholder for the view ID. Every time we call this API we must pass a view id, which is what we got in the id property of the sites list in the previous lesson.
START_DATE_HERE and END_DATE_HERE are placeholders for a date object, which must be specified in the form YYYY-MM-DD or using special names like today or yesterday , which the Google API understands.
The res value contains the result, and we’ll need to dig a bit to get the value we are looking for:
return res.data.reports[0].data.totals[0].values[0]
You can freely explore the other properties of res if you want to take a look.
We can fill those by packaging this code in a function:
async function getDailyData(viewId, startDate, endDate) {
  const analyticsreporting = google.analyticsreporting({
    version: 'v4',
    auth: jwt
  })

  const res = await analyticsreporting.reports.batchGet({
    requestBody: {
      reportRequests: [{
        viewId: viewId,
        dateRanges: [{
          startDate: startDate,
          endDate: endDate
        }],
        metrics: [{
          expression: 'ga:sessions'
        }]
      }]
    }
  })
  return res.data.reports[0].data.totals[0].values[0]
}
which we can call using
async function getData() {
  console.log(await getDailyDataV4('102158511', 'today', 'today'))
}

getData()
Now let’s add one more parameter, which we initialize to false if not set, called isOrganic . If set to true, we’ll tell Google to send us only the organic results:
async function getDailyData(viewId, startDate, endDate, organic = false) {
  const analyticsreporting = google.analyticsreporting({
    version: 'v4',
    auth: jwt
  })

  let filter = ''
  if (organic) {
    filter = 'ga:medium==organic'
  }

  const res = await analyticsreporting.reports.batchGet({
    requestBody: {
      reportRequests: [{
        viewId: viewId,
        dateRanges: [{
          startDate: startDate,
          endDate: endDate
        }],
        metrics: [{
          expression: 'ga:sessions'
        }],
        filtersExpression: filter
      }]
    }
  })
  return res.data.reports[0].data.totals[0].values[0]
}
So with this code we can now get today’s and yesterday’s visits for a single view id, filtered by organic, or total:
async function getData() {
	const viewId = '102158511'
  const data = {
		today: {
			total: await getDailyData(viewId, 'today', 'today'),
			organic: await getDailyData(viewId, 'today', 'today', true),
    },
		yesterday: {
			total: await getDailyData(viewId, 'yesterday', 'yesterday'),
			organic: await getDailyData(viewId, 'yesterday', 'yesterday', true),
    },
  }

  console.log(data)
}
Let’s transform this code to get the data of all the sites we enabled. In getData() , we get the id of each property:
const list = await getPropertiesList()
I create a function getDataOfItem() to get the data of a single site:
const getDataOfItem = async item => {
  return {
    property: item,
    today: {
      total: (await getDailyData(item.id, 'today', 'today')),
      organic: await getDailyData(item.id, 'today', 'today', true),
    },
    yesterday: {
      total: await getDailyData(item.id, 'yesterday', 'yesterday'),
      organic: await getDailyData(item.id, 'yesterday', 'yesterday', true),
    }
  }
}
We iterate on the properties list using map() , and we call this function for each site:
const result = await Promise.all(list.map(item => getDataOfItem(item)))
In this way, we end up with an array that has an entry for each site, and for each site we have all the stats for today and yesterday.
You might wonder why we prepend await and put the mapping inside Promise.all() .
This is because getDataOfItem() is an async function, and as such it returns a promise. Every function returns a promise, so until we can get the result, every promise must resolve, and this is done using Promise.all() .
Then we await the result of Promise.all() , since itself returns a promise.
If this is all highly confusing, please give a read to https://flaviocopes.com/javascript-promises/.
Here’s the full code:
async function getData() {
  const list = await getPropertiesList()

  const getDataOfItem = async item => {
    return {
      property: item,
      today: {
        total: (await getDailyData(item.id, 'today', 'today')),
        organic: await getDailyData(item.id, 'today', 'today', true),
      },
      yesterday: {
        total: await getDailyData(item.id, 'yesterday', 'yesterday'),
        organic: await getDailyData(item.id, 'yesterday', 'yesterday', true),
      }
    }
  }

  const result = await Promise.all(list.map(item => getDataOfItem(item)))
	console.log(result)
}
When we run this program in the console we’ll get an object representation similar to
[ { property: { name: 'flaviocopes.com', id: '102158511' },
    today: { total: '1409', organic: '1069' },
    yesterday: { total: '3429', organic: '2365' } },
  { property: { name: 'nodehandbook.com', id: '180512092' },
    today: { total: '13', organic: '0' },
    yesterday: { total: '51', organic: '2' } } ]
The complete code of this project at this point is available at https://glitch.com/edit/#!/node-course-project-analytics-dashboard-b?path=server.js:49:2
LAST 30 DAYS DATA
Now that we got daily visits, let’s switch to get the last 30 days data.
We want to get the total count of the last 30 days.
To start with, we’ll install Moment to handle dates. In the previous lesson we relied on passing Google today and yesterday . Now we need to property handle dates.
Add moment to the package.json .
Import it using
const moment = require('moment')
We need to get dates in the format YYYY-MM-DD , so here’s how we’ll get them:
moment().format('YYYY-MM-DD') //today
To move around in time, we’ll use the add() and subtract() methods:
moment().add(30, 'days')
moment().subtract(30, 'days')
Check my Moment.js tutorial for more info on this library.
GET LAST 30 DAYS VISITS
In getData(), we get the dates we are looking for using:
const daysAgo30 = moment().subtract(30, 'days').format('YYYY-MM-DD')
const daysAgo60 = moment().subtract(60, 'days').format('YYYY-MM-DD')
and we add to the monthly property the new data points:
monthly: {
  total: await getDailyData(item.id, '30daysAgo', 'today'),
  improvement_total: await getDailyData(item.id, daysAgo60, daysAgo30),
  organic: await getDailyData(item.id, '30daysAgo', 'today', true),
  improvement_organic: await getDailyData(item.id, daysAgo60, daysAgo30, true)
}
GET THE PERCENTAGE INCREMENT OVER PREVIOUS 30 DAYS
Once we have the number, getting the percentage increment (or decrement!) is can be done using this formula:
const total_change_percentage = monthly.improvement_total / monthly.total * 100
const organic_change_percentage = monthly.improvement_organic / monthly.organic * 100
The code at this point is available at https://glitch.com/edit/#!/node-course-project-analytics-dashboard-c?path=server.js
CACHE THE DATA
There’s one thing we need to do now before going to work on the User Interface.
We are making lots of requests to the Google Analytics API. If we don’t do nothing, we’ll quickly exceed the rate limiting quota.
Most of those requests are unnecessary because once we got the last 30 days data, or the aggregates for yesterday, they will not change until tomorrow.
What can we do, then? We can save all the data into a JSON file, and we can load the file data if it’s still recent.
WHERE WE’LL STORE THE DATA
In Glitch, the .data folder is special: data is not migrated if you remix the project, so it’s a perfect place to use as data storage.
DATA STORAGE AND RETRIEVAL
Let’s create a data storage function. We’ll call that storeData() . It writes an object to the .data/data.json file, saving it as JSON.
const fs = require('fs')

const storeData = (data) => {
  try {
    fs.writeFileSync('.data/data.json', JSON.stringify(data))
  } catch (err) {
    console.error(err)
  }
}
The companion function loadData() does the opposite: it reads from the .data/data.json file.
const loadData = () => {
  try {
    const data = JSON.parse(fs.readFileSync(dataFilePath, 'utf8'))
    return data
  } catch (err) {
    console.error(err)
    return false
  }
}
ADD THE DATA INVALIDATION WORKFLOW
The data we cache is valid for the day it was generated. When the day changes, we’ll need to refresh the data. How can we do so?
To simplify the matter, we’ll look at the file update date. If it’s been updated yesterday, or it does not exist, we’ll fetch the data again and save the file. Otherwise, if it’s been updated today we’ll load the data stored in the file.
Today’s data is always updated live, so we’ll extract that part from our codebase, and run it every time we load the data.
We introduce the wasModifiedToday() function, which checks if a file has been modified in the current day. This function uses two support functions: getFileUpdatedDate() and isToday() :
//get the last update date of a file
const getFileUpdatedDate = (path) => {
  const stats = fs.statSync(path)
  return stats.mtime
}

//check if a date is "today"
const isToday = (someDate) => {
  const today = new Date()
  return someDate.getDate() == today.getDate() &&
    someDate.getMonth() == today.getMonth() &&
    someDate.getFullYear() == today.getFullYear()
}

//check if a file was modified "today"
const wasModifiedToday = (path) => {
  return isToday(getFileUpdatedDate(path))
}
Now we can use this function in this way:
const dataFilePath = '.data/data.json'

if (wasModifiedToday(dataFilePath)) {
	//load data from the file
} else {
	//fetch updated data from Google Analytics, and store it to the local file
}
TWEAK HOW WE FETCH THE DATA TO SEPARATE TODAY’S VISITS FROM THE ONES WE CAN CACHE
Since we can cache every data except today’s visits, let’s extract them from the getData() function to getTodayData() .
This is getData() now:
async function getData() {
  const list = await getPropertiesList()

  const daysAgo30 = moment().subtract(30, 'days').format('YYYY-MM-DD')
  const daysAgo60 = moment().subtract(60, 'days').format('YYYY-MM-DD')

  const getDataOfItem = async item => {
    return {
      property: item,
      today: {
        total: (await getDailyData(item.id, 'today', 'today')),
        organic: await getDailyData(item.id, 'today', 'today', true),
      },
      yesterday: {
        total: await getDailyData(item.id, 'yesterday', 'yesterday'),
        organic: await getDailyData(item.id, 'yesterday', 'yesterday', true),
      },
      monthly: {
        total: await getDailyData(item.id, '30daysAgo', 'today'),
        improvement_total: await getDailyData(item.id, daysAgo60, daysAgo30),
        organic: await getDailyData(item.id, '30daysAgo', 'today', true),
        improvement_organic: await getDailyData(item.id, daysAgo60, daysAgo30, true)
      }
    }
  }

  const result = await Promise.all(list.map(item => getDataOfItem(item)))
	console.log(result)
}
We can simply move the today property to getTodayData() :
async function getTodayData() {
  const list = await getPropertiesList()

  const getDataOfItem = async item => {
    return {
      property: item,
      today: {
        total: (await getDailyData(item.id, 'today', 'today')),
        organic: await getDailyData(item.id, 'today', 'today', true),
      }
    }
  }

  return await Promise.all(list.map(item => getDataOfItem(item)))
}
and we remove it from getData() (we also add the return value instead of the console.log() :
async function getData() {
  const list = await getPropertiesList()

  const daysAgo30 = moment().subtract(30, 'days').format('YYYY-MM-DD')
  const daysAgo60 = moment().subtract(60, 'days').format('YYYY-MM-DD')

  const getDataOfItem = async item => {
    return {
      property: item,
      yesterday: {
        total: await getDailyData(item.id, 'yesterday', 'yesterday'),
        organic: await getDailyData(item.id, 'yesterday', 'yesterday', true),
      },
      monthly: {
        total: await getDailyData(item.id, '30daysAgo', 'today'),
        improvement_total: await getDailyData(item.id, daysAgo60, daysAgo30),
        organic: await getDailyData(item.id, '30daysAgo', 'today', true),
        improvement_organic: await getDailyData(item.id, daysAgo60, daysAgo30, true)
      }
    }
  }

  return await Promise.all(list.map(item => getDataOfItem(item)))
}
We wrap all the calls to the specific data retrieval functions in a getAnalyticsData() function, which first checks if the file exists, using fs.existsSync() , and then checks if it was modified today.
If so, it loads the data from there. If not, it loads the data from Google Analytics, and caches it in the file:
const getAnalyticsData = async () => {
  let data = null
  if (fs.existsSync(dataFilePath) && wasModifiedToday(dataFilePath)) {
    data = loadData()
  } else {
    data = {
      aggregate: await getData()
    }
    storeData(data)
  }
  data.today = await getTodayData()
	return data
}

const data = getAnalyticsData()
data.then(data => console.log(data))
Notice we used
data.then(data => console.log(data))
because getAnalyticsData() is an async function, and it returns a promise.
At this point, in the console logs you should first have the data fetched from Google Analytics, but in subsequent reloads the data should be loaded from the file.
CREATE THE USER INTERFACE
Now that we successfully fetched all the data we need, it’s time to start building the interface.
Let’s add an Express server to serve a blank HTML page, in the / path:
const express = require('express')
const app = express()
app.set('view engine', 'pug')
app.set('views', path.join(__dirname, 'views'))

app.get('/', (req, res) => res.render('index'))
app.listen(3000, () => console.log('Server ready'))
and we create a views/index.pug file, with this content:
html
  body
Before this can work we must npm install Pug:
npm install pug
or add it to the package.json file in Glitch.
If you’re unfamiliar with Pug, it’s the version 2 of Jade. Before going on, find and read my introduction at flaviocopes.com/pug.
We’re ready to design the basic UI!
Remember the mockup I posted in the first lesson?
Let’s work on it.
This is not a CSS, design or HTML course, so forgive my poor design skills 
First we include create the HTML skeleton, using Pug. To experiment with Pug and see the resulting HTML, I recommend using PugHtml.
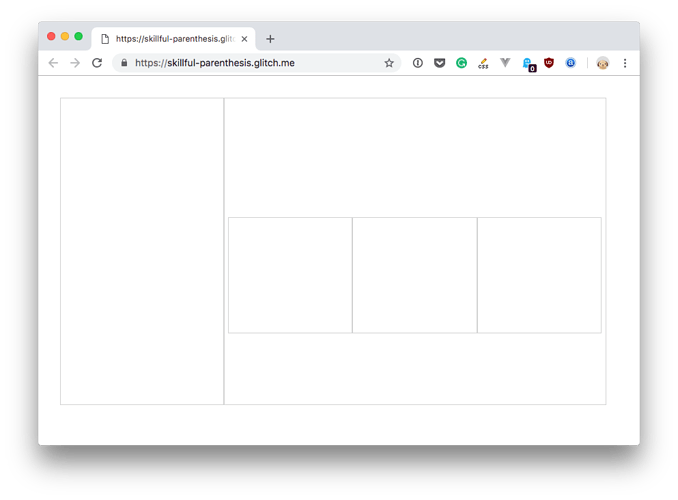
This Pug file:
html
  head
    link(rel='stylesheet', href='css/style.css')
  body
    #container
      #sidebar
      #main
        #select
        #stats
          #today
          #yesterday
          #monthly
will generate this HTML
<html>

<head>
    <link rel="stylesheet" href="css/style.css" />
</head>

<body>
    <div id="container">
        <div id="sidebar"></div>
        <div id="main">
            <div id="select"></div>
            <div id="stats">
                <div id="today"></div>
                <div id="yesterday"></div>
                <div id="monthly"></div>
            </div>
        </div>
    </div>
</body>

</html>
We apply this CSS, saving it to public/style.css :
#container {
  width: 800px;
  display: grid;
  grid-template-columns: 30% 70%;
}
#sidebar, #main {
  border: 1px solid lightgray;
  height: 450px;
}
#main {
  display: grid;
  grid-gap: 10px;
}

#select {
  border: 1px solid lightgray;
  height: 60px
}

#stats {
  display: grid;
  grid-template-columns: 33% 33% 33%;
  padding-left: 5px
}

#today,
#yesterday,
#monthly {
  border: 1px solid lightgray;
  height: 170px
}
This will give a nice structure to our page:
We are now going to fill those boxes with the data.
First, let’s add the list of sites to the sidebar, with an “All” at the top.
We must first add the data to our Pug template. We can do so by passing data in the res.render() function:
app.get('/', (req, res) => res.render('index', data))
Now we can reference each property of the data object in our template.
I mentioned we are going to put an “All” menu at the top, which is the default. However, we don’t sum those numbers yet in the backend.
Let’s do it.
Tweak the getAnalyticsData() method by adding, at the end of it, this snippet:
data.sums = data.aggregate.reduce(( acc, current ) => {
    return {
        today: {
            total: parseInt(current.today.total) + parseInt(acc.today.total),
            organic: parseInt(current.today.organic) + parseInt(acc.today.organic)
        },
        yesterday: {
            total: parseInt(current.yesterday.total) + parseInt(acc.yesterday.total),
            organic: parseInt(current.yesterday.organic) + parseInt(acc.yesterday.organic)
        },
        monthly: {
            total: parseInt(current.monthly.total) + parseInt(acc.monthly.total),
            organic: parseInt(current.monthly.organic) + parseInt(acc.monthly.organic)
        }
    }
  }, {
    today: { total: 0, organic: 0},
    yesterday: { total: 0, organic: 0},
    monthly: { total: 0, organic: 0}
  })
If you are unfamiliar with reduce , it’s a way to transform an array into a single value.
You know map already. Well, reduce is just like map as it iterates an array, but instead of returning a new array, it returns a single element. In this case, we provide an initial value:
{
	today: { total: 0, organic: 0},
	yesterday: { total: 0, organic: 0},
	monthly: { total: 0, organic: 0}
}
and we increment it on every iteration, adding the values of each site analytics to the sum.
The result is the same object, but with the values updated with the counts.
We also add to data the names of the sites, so they are easily accessible in our template:
  data.sites = data.aggregate.map(item => {
    return {
      name: item.property.name,
      id: item.property.id
    }
  })
Now we’re ready to add those values into the Pug template:
html
  head
    link(rel='stylesheet', href='style.css')
  body
    #container
      #sidebar
        ul
          li.active All
          each site in sites
            li= site.name
As you can see we add a loop to iterate the sites property of the data object we passed to the view.
We set the “All” element to have the active class, so we can style it properly later.
Let’s add the data. This is not a frontend course, so we’ll write both organic and total data in the HTML, and show/hide using CSS, defaulting to show total data first.
#main
  #select
  #stats
    #today
      h2 Today
      p.total #{sums.today.total}
      p.organic.hidden #{sums.today.organic}
    #yesterday
      h2 Yesterday
      p.total #{sums.yesterday.total}
      p.organic.hidden #{sums.yesterday.organic}
    #monthly
      h2 Last 30
      p.total #{sums.monthly.total}
      p.organic.hidden #{sums.monthly.organic}
The last pug thing we’ll add now is the links to select to show the total or organic filter:
#main
  #select
    a(class='button total active' href='#') Total
    a(class='button organic' href='#') Organic
We’re done with Pug for now. Let’s switch to some CSS and frontend JavaScript.
CSS, LET’S STYLE IT
Let’s style the sidebar list, and create a special style if there is the active class on an element:
#sidebar ul {
  padding: 0;
  margin-top: 0;
}

#sidebar li {
  list-style-type: none;
  border-bottom: 1px solid lightgray;
  padding: 20px;
}

#sidebar li.active {
  background-color: gray;
  color: white;
}
Then let’s style the buttons to choose total or organic:
#select {
  width: 300px;
  margin: 0 auto;
  padding-top: 20px;
  text-align: center;
}

#select a {
  padding: 30px;
  color: #666;
}

#select a.active {
  font-weight: bold;
  text-decoration: none;
}
Finally, we hide elements with the hidden class:
.hidden {
  display: none;
}
FRONTEND JS
In terms of frontend JavaScript we need to do one thing here: when pressing the “Organic” select button, we’ll show the organic numbers.
Otherwise we show the total numbers, which is the default.
To do this, we add the hidden class to all items with the total class, and we remove that class to the organic class elements.
Also, we’ll add the active class the the select link that was clicked, and remove it from the other one. Let’s do it!
If you are a jQuery user, it might be tempting to use it, but we’ll use the native browser APIs instead.
How?
First we listen for the DOMContentLoaded event to make sure the DOM is loaded when we perform our operations.
Then we listen for click events on each of the 2 select button (Total/Organic):
document.addEventListener('DOMContentLoaded', (event) => {
  const buttons = document.querySelectorAll("#select .button")
  for (const button of buttons) {
    button.addEventListener('click', function(event) {

    })
  }
})
Inside this, we first remove the active class from both the buttons, and we add it to the one we clicked:
//...
button.addEventListener('click', function(event) {
  for (const button of buttons) {
    button.classList.remove('active')
  }

  this.classList.add('active')
Then we hide and show the organic or total stats, depending on the class contained in the button:
//...
const organicStats = document.querySelectorAll('#stats .organic')
const totalStats = document.querySelectorAll('#stats .total')

if (this.classList.contains('organic')) {
  for (const item of organicStats) {
    item.classList.remove('hidden')
  }
  for (const item of totalStats) {
    item.classList.add('hidden')
  }
} else {
  for (const item of organicStats) {
    item.classList.add('hidden')
  }
  for (const item of totalStats) {
    item.classList.remove('hidden')
  }
}
Here’s the full code of the JavaScript file:
document.addEventListener('DOMContentLoaded', (event) => {
  const buttons = document.querySelectorAll("#select .button")
  for (const button of buttons) {
    button.addEventListener('click', function(event) {
      for (const button of buttons) {
        button.classList.remove('active')
      }

      this.classList.add('active')

      const organicStats = document.querySelectorAll('#stats .organic')
      const totalStats = document.querySelectorAll('#stats .total')

      if (this.classList.contains('organic')) {
        for (const item of organicStats) {
          item.classList.remove('hidden')
        }
        for (const item of totalStats) {
          item.classList.add('hidden')
        }
      } else {
        for (const item of organicStats) {
          item.classList.add('hidden')
        }
        for (const item of totalStats) {
          item.classList.remove('hidden')
        }
      }

      event.preventDefault()
    })
  }
})
That’s it for now!
You can find the code up to now in https://glitch.com/edit/#!/node-course-project-analytics-dashboard-d.
In the next lesson we’ll add ability to only show the data of a single site, rather than the sum of all visits.
FILTERING BY SITE
When we click an item in the sidebar we want to make that the active element (we remove the active class from all the other elements and add it to the one just clicked).
Also, we’ll perform a fetch request to the backend, we’ll create a simple API endpoint that returns the data as JSON, optionally filtered by site, so if we pass the site as parameter we get that filtered.
Last, we’ll update the DOM with the new data.
Let’s go!
First we intercept the click event on any sidebar item, and we assign to the active class to the element clicked:
const sidebarLinks = document.querySelectorAll("#sidebar li")

for (const sidebarLink of sidebarLinks) {
  sidebarLink.addEventListener('click', function(event) {
    for (const sidebarLink of sidebarLinks) {
      sidebarLink.classList.remove('active')
    }
    this.classList.add('active')
  })
}
Then we filter the data.
We create a fetchStats() function to ask the server that specific site data:
const fetchStats = site => {
  fetch('/stats?site=' + encodeURIComponent(site)).then(response => {
    //...
  })
  .catch(err => console.error(err))
}
We call this function in the event listener, passing the text contained in the sidebar item (referenced using textContent ):
const sidebarLinks = document.querySelectorAll("#sidebar li")

for (const sidebarLink of sidebarLinks) {
  sidebarLink.addEventListener('click', function(event) {
    for (const sidebarLink of sidebarLinks) {
      sidebarLink.classList.remove('active')
    }
    this.classList.add('active')
    fetchStats(this.textContent)
  })
}
On the server side, we listen on the /stats endpoint and based on the site query parameter, we return either all the data, or we filter the data to only return a specific site data:
app.get('/stats', (req, res) => {
  const site = req.query.site

  if (site === 'All') {
    res.json(data.sums)
    return
  } else {
    const filteredData = data.aggregate.filter(item => item.property.name === site)
    res.json(filteredData[0])
  }
})
Now we need to alter the data in the DOM.
We can do it in the fetchStats() function callback. We first parse the JSON response using
fetch('/stats?site=' + encodeURIComponent(site))
  .then(response => response.json())
  .then(body => {

  })
and inside the last then we can access the body values. We’ll assign them to each DOM element using innerText :
const fetchStats = (site) => {
  fetch('/stats?site=' + encodeURIComponent(site)).then(response => response.json())
    .then(body => {
    document.querySelector('#today .total').innerText = body.today.total
    document.querySelector('#today .organic').innerText = body.today.organic
    document.querySelector('#yesterday .total').innerText = body.yesterday.total
    document.querySelector('#yesterday .organic').innerText = body.yesterday.organic
    document.querySelector('#monthly .total').innerText = body.monthly.total
    document.querySelector('#monthly .organic').innerText = body.monthly.organic
  })
  .catch(err => console.error(err))
}
We’re done! We can now see the values update when we click a site on the sidebar.
The full code is available at https://glitch.com/edit/#!/node-course-project-analytics-dashboard-e and the app working is at https://node-course-project-analytics-dashboard-e.glitch.me/
CHALLENGES
If you got the mentoring package, you can clone the project at https://github.com/flaviocopes/node-course-project-analytics-dashboardand implement the following coding challenges. Once you are done, email me and I will review your work (if you got the mentoring package!)
- Notice how we calculated a percentage increment over the last 30 days over the previous 30 days. Add this data in the frontend, to show how good we’re doing.
- Try to implement this as an API with a separate frontend (in React or Vue, for example) that consumes it, rather than using Node to generate the frontend. Skip if you’re not interested in creating a frontend too.
You can do those challenges later after you completed the other projects in the course, as it might take more time than you can currently dedicate (and some might also be too advanced right now)
